 
          DOMINION BOULEVARD CORRIDOR STUDY  |  Chesapeake, Virginia
        
        
          24  |  Market Study
        
        
          Market Study  |  25


              Retail


          The market appears to have stabilized.
        
        
          Vacancy rates continue to drop and as of
        
        
          2014- Q1 were at 6.5%, and rents have
        
        
          remained stable at approximately $13/
        
        
          net net net (nnn) average rate. There was
        
        
          limited construction during the downturn,
        
        
          which, in turn, has allowed the market to
        
        
          recover relatively quickly. Retail growth is
        
        
          tied to household growth, so as the region
        
        
          continues to gain households, retail will grow
        
        
          as well.
        
        
          Currently, the retail market, as defined by
        
        
          a 10-mile radius around the Study Area,
        
        
          is mostly in balance relative to demand,
        
        
          and includes many active retail areas that
        
        
          provide high amenity benefit for nearby
        
        
          residents and employees. The area,
        
        
          which includes a Walmart store, captures
        
        
          Long-term, the growth in Professional and
        
        
          Business Services and Health Services as
        
        
          well as other office-oriented employment will
        
        
          help bolster the office market.
        
        
          The office market in the VA Beach MSA
        
        
          has only recently begun to recover from
        
        
          a dramatic contraction from 2008 through
        
        
          2011. From 2006 to 2013, the average
        
        
          annual office absorption was only half
        
        
          the volume of office space delivered in
        
        
          the MSA. Construction activity dipped to
        
        
          150,000 square feet in 2012 (less than 10%
        
        
          of the highest annual completion levels
        
        
          before the downturn). Net absorption was
        
        
          close to -500,000 square feet in 2011. The
        
        
          market appears to be improving, showing
        
        
          a promising uptick in both absorption,
        
        
          completions, occupancy, and rent growth in
        
        
          2013. See Figure 12.


              Industrial


          The Hampton Roads region is unique in that
        
        
          it has almost double the amount of industrial
        
        
          space (96M SF) than office space (48M SF).
        
        
          The industrial market is performing relatively
        
        
          significant spending from outside residents
        
        
          for general merchandise, electronics,
        
        
          and apparel products. Although there are
        
        
          multiple grocery stores in the north and east
        
        
          half of the retail area, there exists an under
        
        
          supply of food and beverage, health and
        
        
          personal care retail. It is estimated that $22
        
        
          million in annual sales of food and beverage
        
        
          are spent outside of the area due to a lack
        
        
          of large-scale grocery stores in the southern
        
        
          side of Dominion Boulevard.


              Office


          The office market is still in recovery, but
        
        
          2014 is expected to be better than 2013,
        
        
          suggesting the office market will soon be
        
        
          in recovery as well. Vacancy rates as of
        
        
          2014-Q1 were 11.5%, and average rents
        
        
          at $16.44/square foot (SF), below the
        
        
          peak of $18.41/SF. Office growth is tied
        
        
          to employment growth, and 2013 was
        
        
          challenged by sequestration which impacted
        
        
          defense and government contracting
        
        
          companies in the region.


              Exhibit II-7


            PERCENT NEW HOME SALES BY YEAR


            HAMPTON ROADS AREA


            2000-2013


            Year


            % New


          2000
        
        
          30.0%
        
        
          2001
        
        
          35.0%
        
        
          2002
        
        
          31.0%
        
        
          2003
        
        
          29.0%
        
        
          2004
        
        
          34.0%
        
        
          2005
        
        
          32.0%
        
        
          2006
        
        
          30.0%
        
        
          2007
        
        
          26.0%
        
        
          2008
        
        
          22.8%
        
        
          2009
        
        
          17.8%
        
        
          2010
        
        
          16.9%
        
        
          2011
        
        
          15.6%
        
        
          2012
        
        
          16.7%
        
        
          2013
        
        
          15.3%


            % NEW HOME SALES


          15.0%
        
        
          20.0%
        
        
          25.0%
        
        
          30.0%
        
        
          35.0%
        
        
          40.0%
        
        
          15,000
        
        
          20,000
        
        
          25,000
        
        
          30,000
        
        
          35,000
        
        
          SOURCE:  Residential DataBank (2000-2011), Old Dominion University (2012-2013)
        
        
          0.0%
        
        
          5.0%
        
        
          10.0%
        
        
          0
        
        
          5,000
        
        
          10,000
        
        
          2000 2001 2002 2003 2004 2005 2006 2007 2008 2009 2010 2011 2012 2013
        
        
          Resales
        
        
          New Sales
        
        
          % New


            Exhibit II-7


          E4-11982.40
        
        
          Printed: 3/27/2014


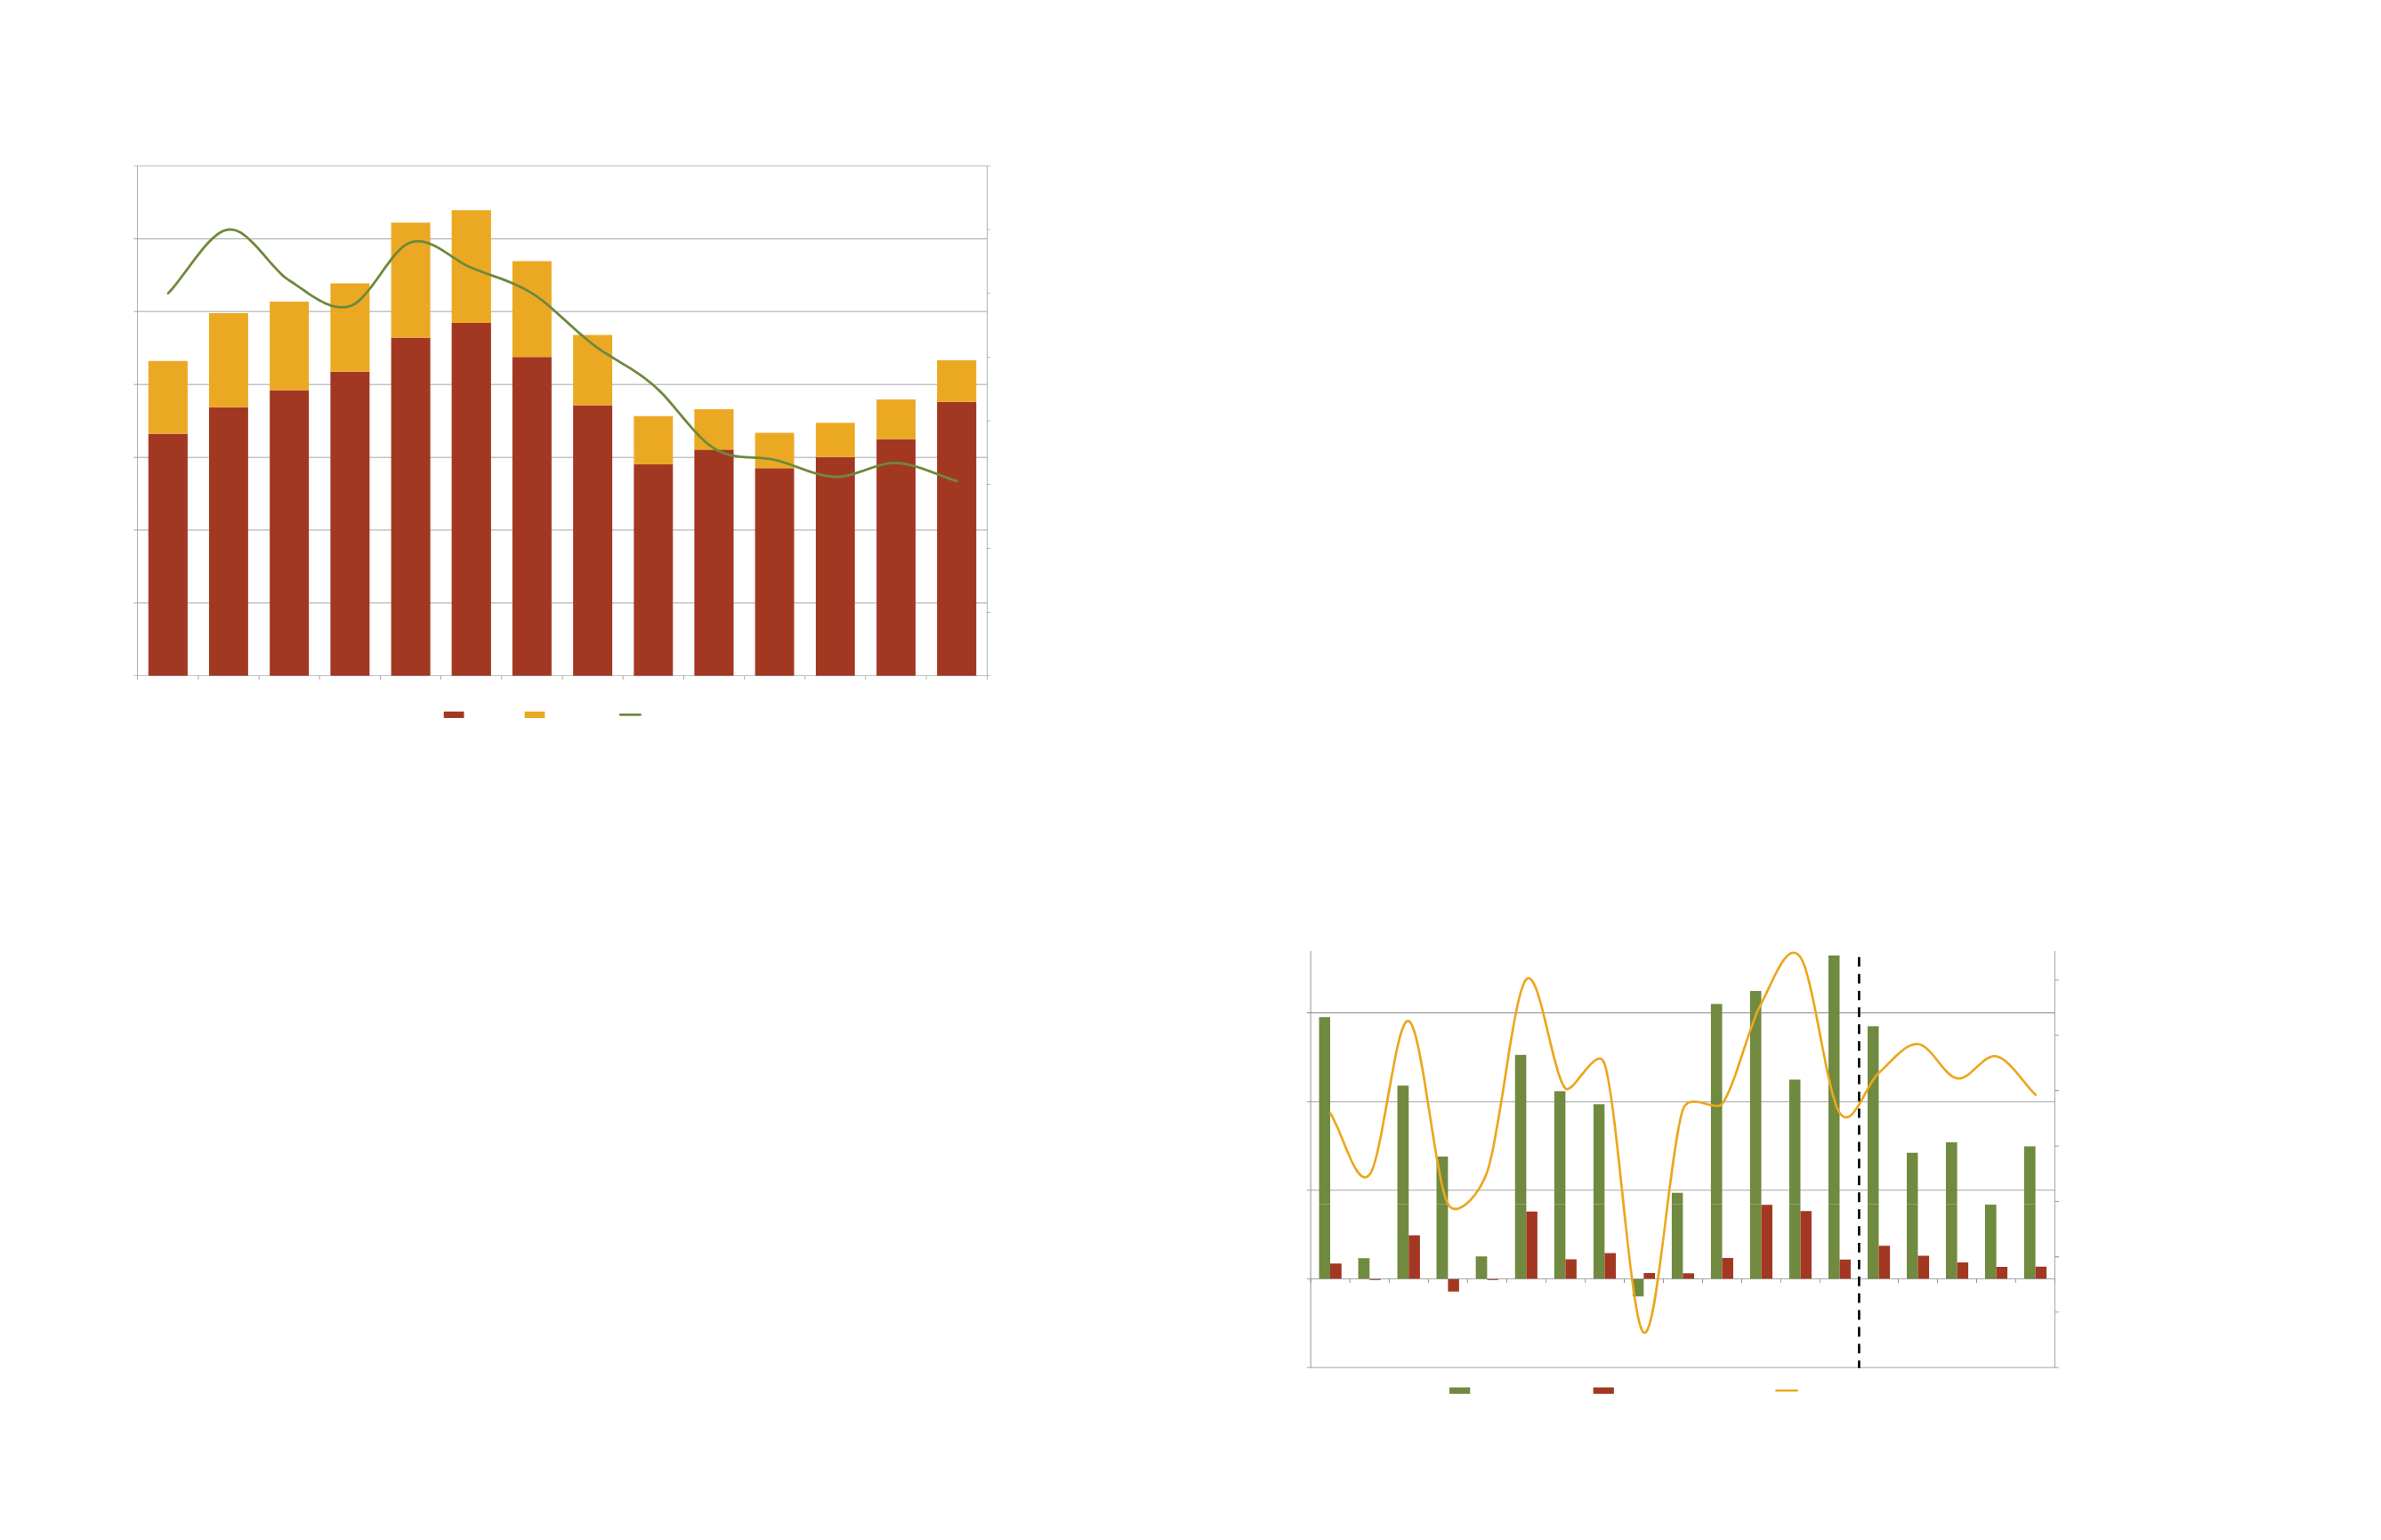
            Figure 10: New and Resale Homes by Year,


            Hampton Roads Areal 2 0-2013


            Source: Residential DataBank (2000-2011),


            Old Dominion University (2012-2013)


            Figure 11: Apartment


            Submarket Absorption


            Capture, Chesapeake


            and Norfolk/Hampton


            Roads Region; 2000-


            2013 Source: Reis


          well with only 8% vacancy rates and rental
        
        
          rates close to $5/nnn SF. The challenge
        
        
          for future industrial is that the types of
        
        
          jobs that lead to industrial development
        
        
          (Manufacturing, Trade) are expected to
        
        
          decrease. Manufacturing is expected to
        
        
          increase after the large losses from 2001-
        
        
          2010, but Trade, Transportation, and Utilities
        
        
          is expected to decrease for the foreseeable
        
        
          future. Opportunities in industrial are tied
        
        
          to the obsolescence of old buildings, and
        
        
          finding niche opportunities.
        
        
          At the MSA level, the industrial market had
        
        
          a challenging 2013 after a brief recovery
        
        
          from the recession. Average industrial rents
        
        
          and occupancy appeared to bottom in 2010,
        
        
          at $4.50 and 90%. The market delivered a
        
        
          total of over a million square feet of industrial
        
        
          space over the two years, allowing rent and
        
        
          vacancy to recover to nearly 2007/2008
        
        
          levels. Vacancy has continued to drop from
        
        
          the high in 2009. In 2013, however, the MSA
        
        
          experienced net negative absorption. Rents
        
        
          have slipped slightly from $4.90 in 2010
        
        
          down to $4.60 in 2013.


              Exhibit III-5


            CHESAPEAKE SUBMARKET CAPTURE OF NORFOK-HAMPTON ROADS APARTMENT ABSORPTION


            CHESAPEAKE AND NORFOLK-HAMPTON ROADS REGION


            2000-2018


          -10%
        
        
          0%
        
        
          10%
        
        
          20%
        
        
          30%
        
        
          40%
        
        
          500
        
        
          1,000
        
        
          1,500
        
        
          2,000


            PROJECTED


            2000-2013 AVG. CAPTURE:


          9%
        
        
          SOURCE: REIS
        
        
          -40%
        
        
          -30%
        
        
          -20%
        
        
          -500
        
        
          0
        
        
          2000 2001 2002 2003 2004 2005 2006 2007 2008 2009 2010 2011 2012 2013 2014 2015 2016 2017 2018
        
        
          Metro Absorption
        
        
          Chesapeake Absorption
        
        
          % Capture of Region


            Exhibit III-5


          E4-11982.40
        
        
          Printed: 3/27/2014
        
        
          CITY OF CHESAPEAKE