DOMINION BOULEVARD CORRIDOR STUDY | Chesapeake, Virginia
22 | Market Study
Market Study | 23
Hampton Roads Employment Growth
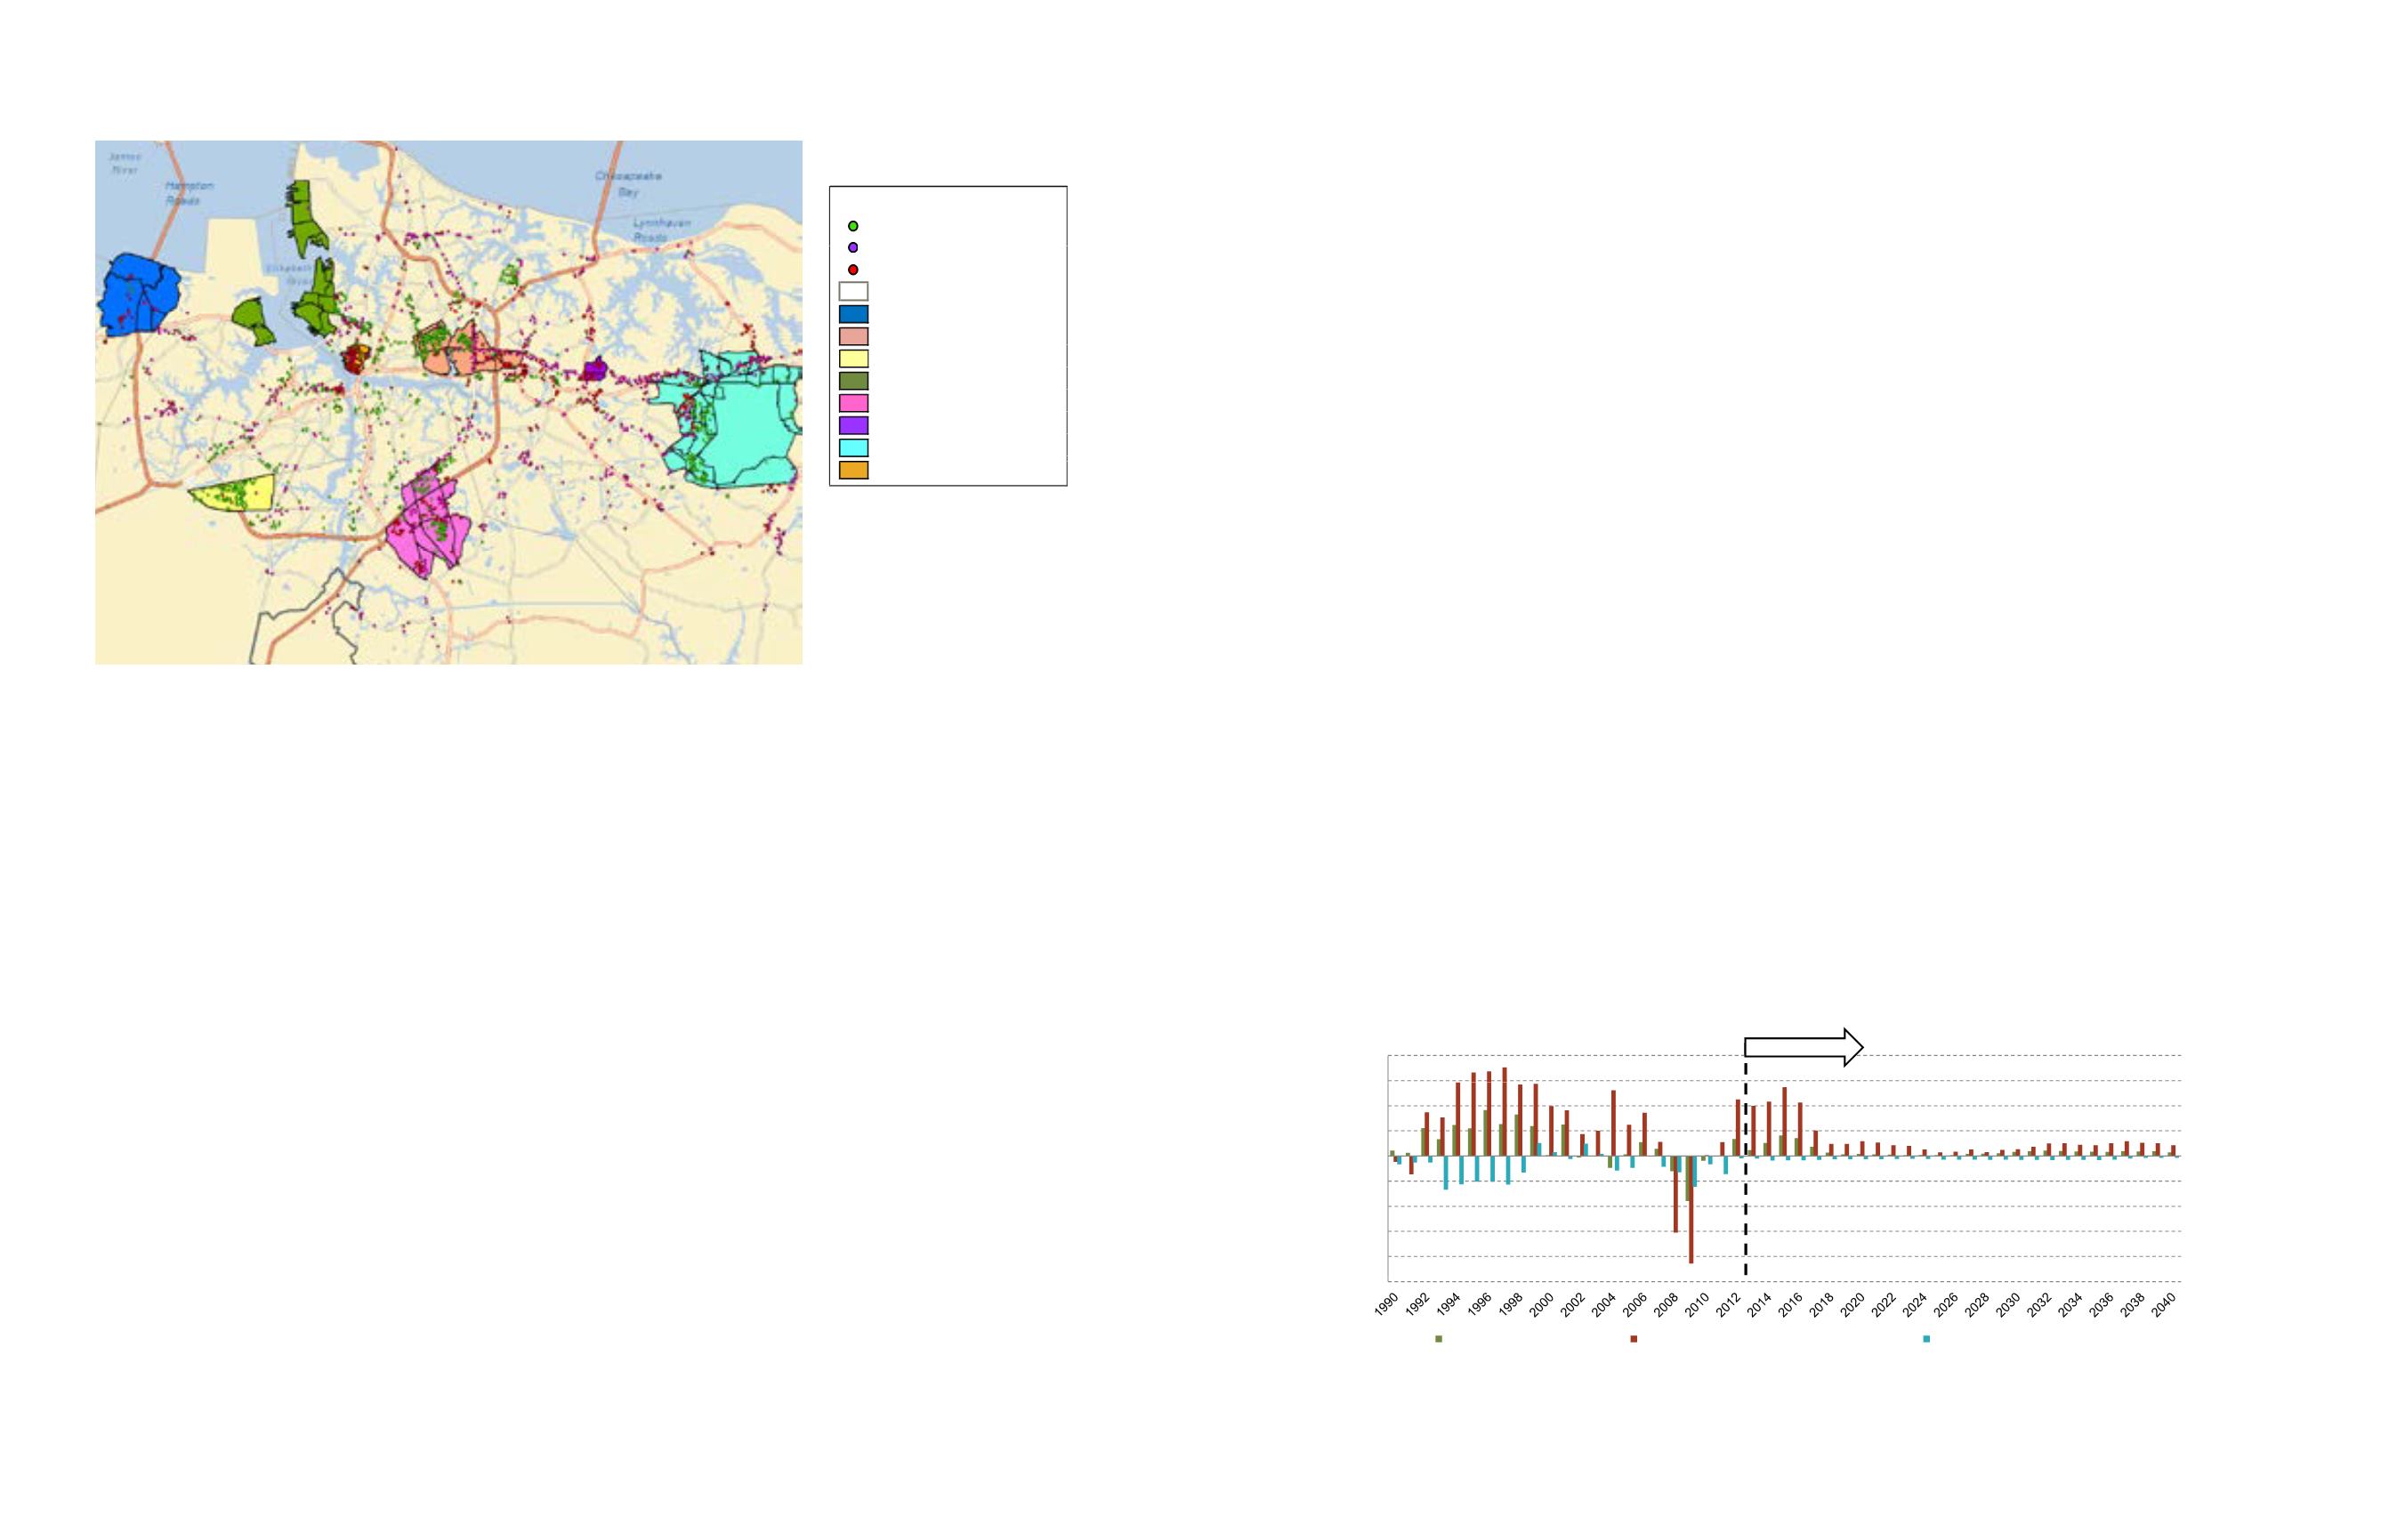
Like most of the United States, the Hampton Roads region was
significantly impacted by the Great Recession. Employment dropped,
home sales plummeted, and commercial vacancies rose. Most of the
sectors are in recovery, and the next few years should see better
performance in most of the real estate classes.
However, between 2020 and 2030, the growth will slow to 4,000 new
jobs annually. Their long-term projections do not take into account
major future recessions, but there are likely to be ups and downs in the
next 20 years.
The economic and demographic outlook for the region is projected to
be moderate for the next ten years. Between 2010 and 2020, Moody’s
projects that the MSA will add an average of 5,900 jobs annually.
As stated earlier, the Hampton Roads TPO projections are in-line with
Moody’s projections, but slightly more optimistic.
15 000
20,000
PROJECTED
Annual Employment Growth
Virginia Beach-Norfolk-Newport News, VA-NC MSA; 1990-2040
5 000
0
5,000
10,000
,
25 000
-20,000
-15,000
-10,000
- ,
- ,
Office Employment Growth
Total Employment Growth Excluding Military
Military Employment Growth
NOTE: This Data does not include military or government employment
Dominion Boulevard | City of Chesapeake | April 11, 2014 | E4-11982.40
26
Source: Moody’s Economy.com
Figure 9: Annual Employment Growth, Virginia Beach-
Norfolk-Newport News, VA-NC MSA; 1990-2040
ncentrated on the seven employment cores
ct location of each of these cores is primarily
transportation routes, the unique topography
located in Exhibit V-15.
Approximately 30% of the current
employment base in the Hampton Roads region is contained
within these seven cores.
reas seemingly next to each other on a map,
s
ter
City of Chesapeake | April 11, 2014 | E4-11982.40
sri
of the region that divides areas seemingly next to each other on a map,
Map of Employment Cores
Hampton Roads Region
Industrial building
Offi
b ildi
MAP KEY
ce u ng
Retail building
Study Area
Harborview
Norfolk Ind. Park Area
Cavalier
Port Area
Greenbrier
Virginia Beach Town Center
Lynnhaven/Oceana
Downtown Norfolk
Dominion Boulevard | City of Chesapeake | April 11, 2014 | E4-11982.40
21
Source: RCLCO; CoStar; Esri
Figure 8: Map of Employment Cores
in the Hampton Roads Region
Source: RCLCO, CoStar
Household growth in the region is tied to
both primary home development related to
jobs and to retirement home growth which
is less dependent upon job growth. The
region is very attractive for both groups of
households given the relatively low cost of
living, good schools, nice climate, amenity
base, and location close to the ocean.
For-rent residential
The for-rent residential market is currently
very strong. Vacancies are low and rents
are increasing. There has been a lot of new
development recently in the rental market in
the region, so the opportunity for additional
short-term rental many not be as strong as
it was a few years ago. However, long-term,
the apartment market should remain strong.
The rental market includes both multifamily
rentals as well as single-family rentals.
The Chesapeake submarket and the
Hampton Roads region have historically
experienced balanced deliveries and
net absorption. From 2000 to 2013, the
submarket has, on average, delivered
150 units and absorbed a net of 133
units annually, capturing 9% of rental
absorption in the region. The Chesapeake
submarket absorbed 418 units in 2011 and
delivered 523 units in 2012, both marking
the highest levels in at least two decades.
The submarket’s capture of regional rental
absorption also reached a record high of
over 30% in 2012, though the long term
trend points to future capture at around
10% to 15%. Chesapeake, like much of the
region, is experiencing healthy vacancies
and rental rates. Though the submarket
does not command rents as high as
Kempsville and Lynnhaven, it is located near
the more expensive areas and has room to
grow. See Figure 11.
Key Findings - Market
While completing a long-term forecast for
an area over a 20+ year horizon, the current
state of the market is not as critical as with
a development project that is slated to start
and be finished within a five-year timeframe.
However, understanding the current
market provides us with the opportunity to
understand where the study area fits into the
region, as well as provide an understanding of
short-term opportunities.
sales. The number of total sales rose nearly
10% from 2011 to 2012 and 14% from 2012
to 2013. New home sales as a percentage
of total sales has steadily declined since
2004 from 34% to 15%. Both sales pace
and median price show clear increases
from 2012 and indicate growth and recovery
in the new for-sale housing market. See
Figure 5.
For-sale residential
The for-sale residential market is slowly
recovering from the Great Recession. Home
prices are up and inventory is down. The
Hampton Roads region still has a large
number of foreclosures to work through the
system. However, all indicators point to a
continued recovery, and long-term health in
the for-sale market. For-sale housing also
represents a strong short-term opportunity
in the study area.
The Hampton Roads housing market has
been slow to recover from the recession.
After a rapid rise in median existing single-
family home prices in the early 2000s, the
market hit a bottom in 2012 and only began
to see meaningful gains in 2013. The volume
of total home sales remained stagnant from
2008 through 2011, averaging 17,500 annual


