DOMINION BOULEVARD CORRIDOR STUDY | Chesapeake, Virginia
102 | Infrastructure Strategy
Infrastructure Strategy | 103
Trip Distribution
Based on current traffic patterns and the planned changes with the study area, the following
scenario was developed to project how traffic would flow to and from the proposed areas.
The following table summarizes the proposed distributions.
Directional Distribution
Direction
Approach/Departure
Primary Trip Distribution
From/To the
NORTH
35%
From/To the
SOUTH
20%
From/To the
WEST
15%
From/To the
EAST
30%
Total
100%
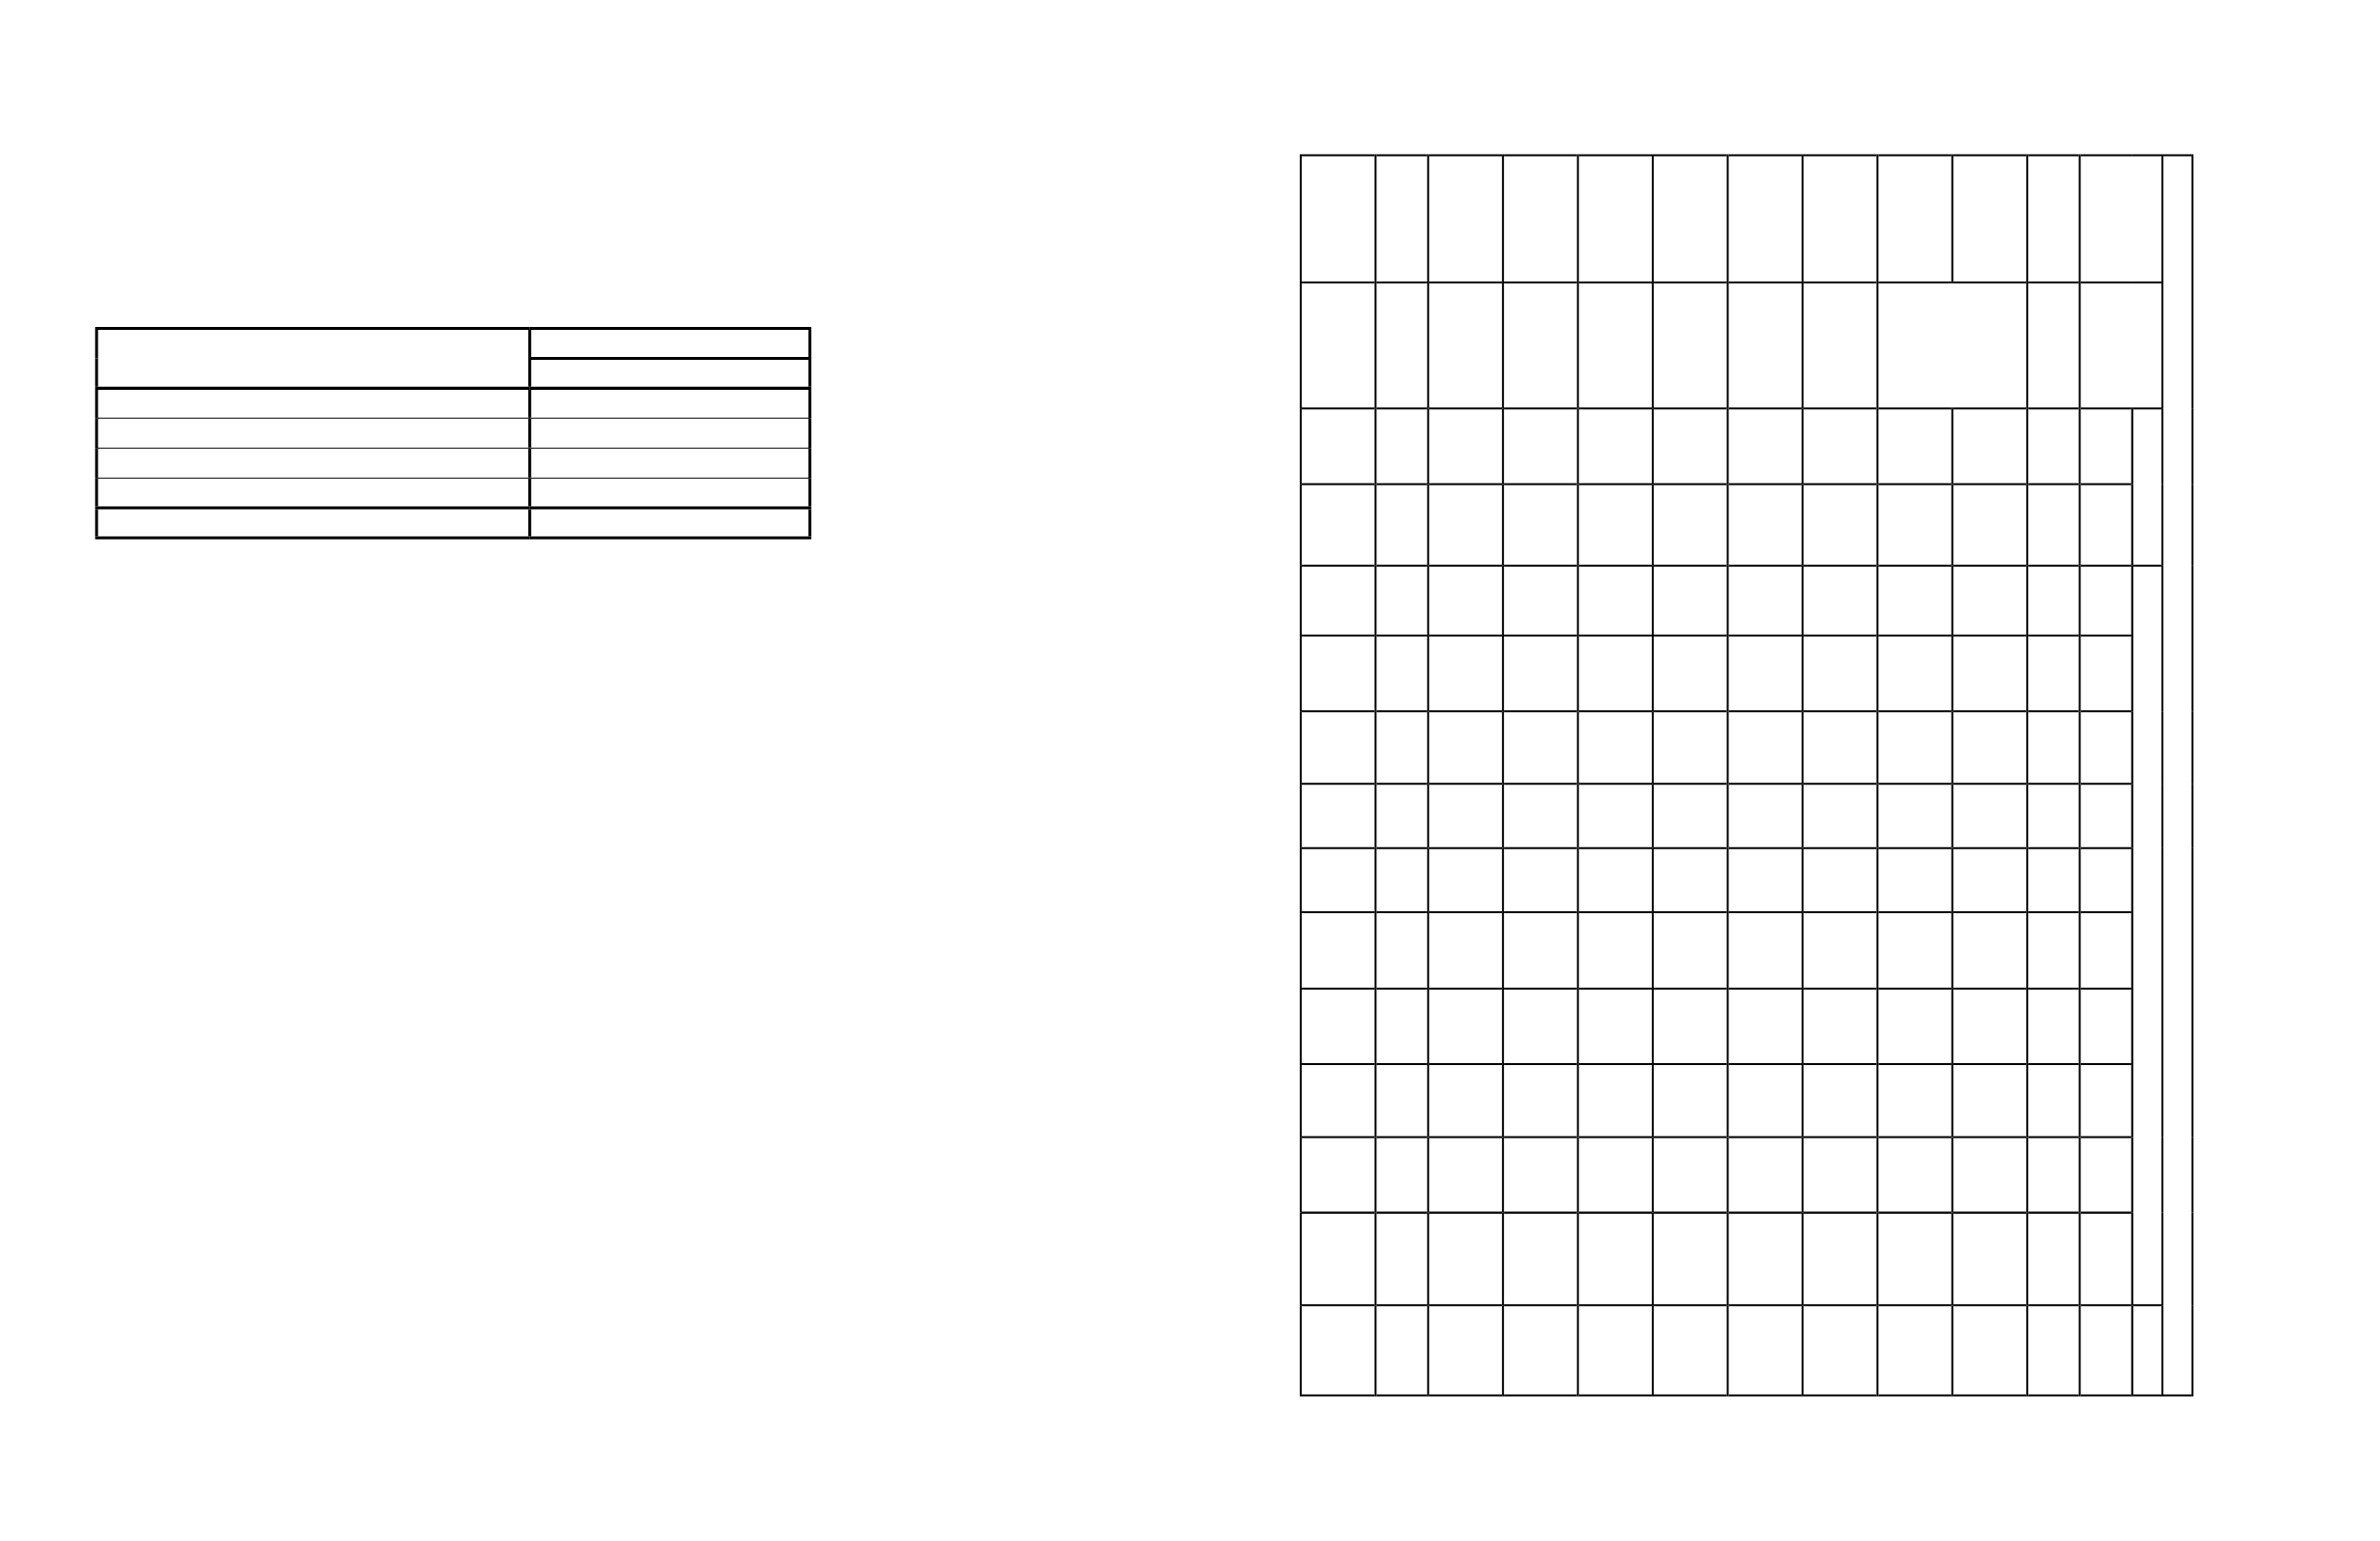
Projected Volumes
Using the distributed volumes and the available average daily traffic (ADT) volumes
available for the roadways within the project area, required roadway lanes were developed.
The existing ADTs were projected to 2034 using a 1% growth per year factor to account for
background traffic growth outside of the project area.
The following table shows the anticipated 2034 Total ADT volumes.
Table 10: Projected traffic volumes
Projected 2034 Traffic Volumes
Limits
Street
ADT
Trip Generation
2014
2034
Area 1 Area 2 Area 3 Area
4
Area
5
Area 6 Area 7 Area 8 Area 9 Area 10
2034
Total
South of
Cedar Rd
Dominion
Blvd
11,990 14,630
932
1,709 14,094 2,950 4,175 19,463
857
391
943
7,667
67,811
East of
Dominion
Blvd
Cedar Rd
26,160 31,920 1,399 4,060
1,180 1,518 9,268
343
156
377
3,067
53,288
South of
Moses
Grandy Trail
6,980
8,517
4,697 1,180
14,394
West of
Dominion
Blvd
Moses
Grandy Trail
13,080 15,960
699
1,282
5,638 1,180
257
117
283
2,300
27,716
East of
Dominion
Blvd
Grassfeld
Pkwy
7,440
9,078
4,228
13,306
South of
Dominion
Blvd
Shillelagh Rd 2,530
3,087
7,517
295
380
4,634
171
78
189
1,533
17,844
South of
Dominion
Blvd
Scenic Pkwy
5,220
6,369
10,805 295 3,795
21,264
South of
Dominion
Blvd
West Rd
3,220
3,929
857
391
15,334
20,622
South of
Dominion
Blvd
Pleasant
Grove Pkwy
N/A
N/A
1,879
3,795 9,268
1,714
781
1,885
15,334
34,656
South of
Cedar Rd
Cahoon Pkwy 10,360 12,641
10,336
171
78
189
1,533
24,948
North of
Dominion
Blvd
George
Washington
Hwy
4,560
5,564
1,180 1,518 9,268
17,530
Table 9: Trip distribution


