DOMINION BOULEVARD CORRIDOR STUDY | Chesapeake, Virginia
100 | Infrastructure Strategy
Infrastructure Strategy | 101
The base model was developed by Parsons Brinkerhoff for the previous phase of the Do-
minion Boulevard/Route 17 improvements project. The following table represents the inter-
section level of service based upon the projected 2034 volumes and the Parsons Brinkerhoff
Synchro model. The signalized intersections that have available turning movement data are
shown in the following table with corresponding LOS as determined by modeling the traf-
fic volumes in Synchro. The LOS of a signalized intersection is based upon the amount of
delay vehicles will experience at the intersection. Intersection LOS ranges from A (free flow)
through F (forced flow-jammed). The goal is to obtain a LOS D or better within the project
area.
Intersection
PM Peak Hour LOS
Dominion Blvd. & Cedar/Moses Grandy Trail
C
Dominion Blvd. & Grassfeld Pkwy.
B
Dominion Blvd. & Scenic Pkwy.
C
Dominion Blvd. & George Washington Hwy.
A
Cedar Rd. & Cahoon Pkwy.
E
Moses Grandy Trail & Cedar Rd.
B
Trip Generation
The Institute of Transportation Engineers (ITE) Trip Generation Manual, 9th Edition was
used to calculate the anticipated trips generated from the different land uses proposed
within the 4 areas based on the proposed development plan and are summarized in the
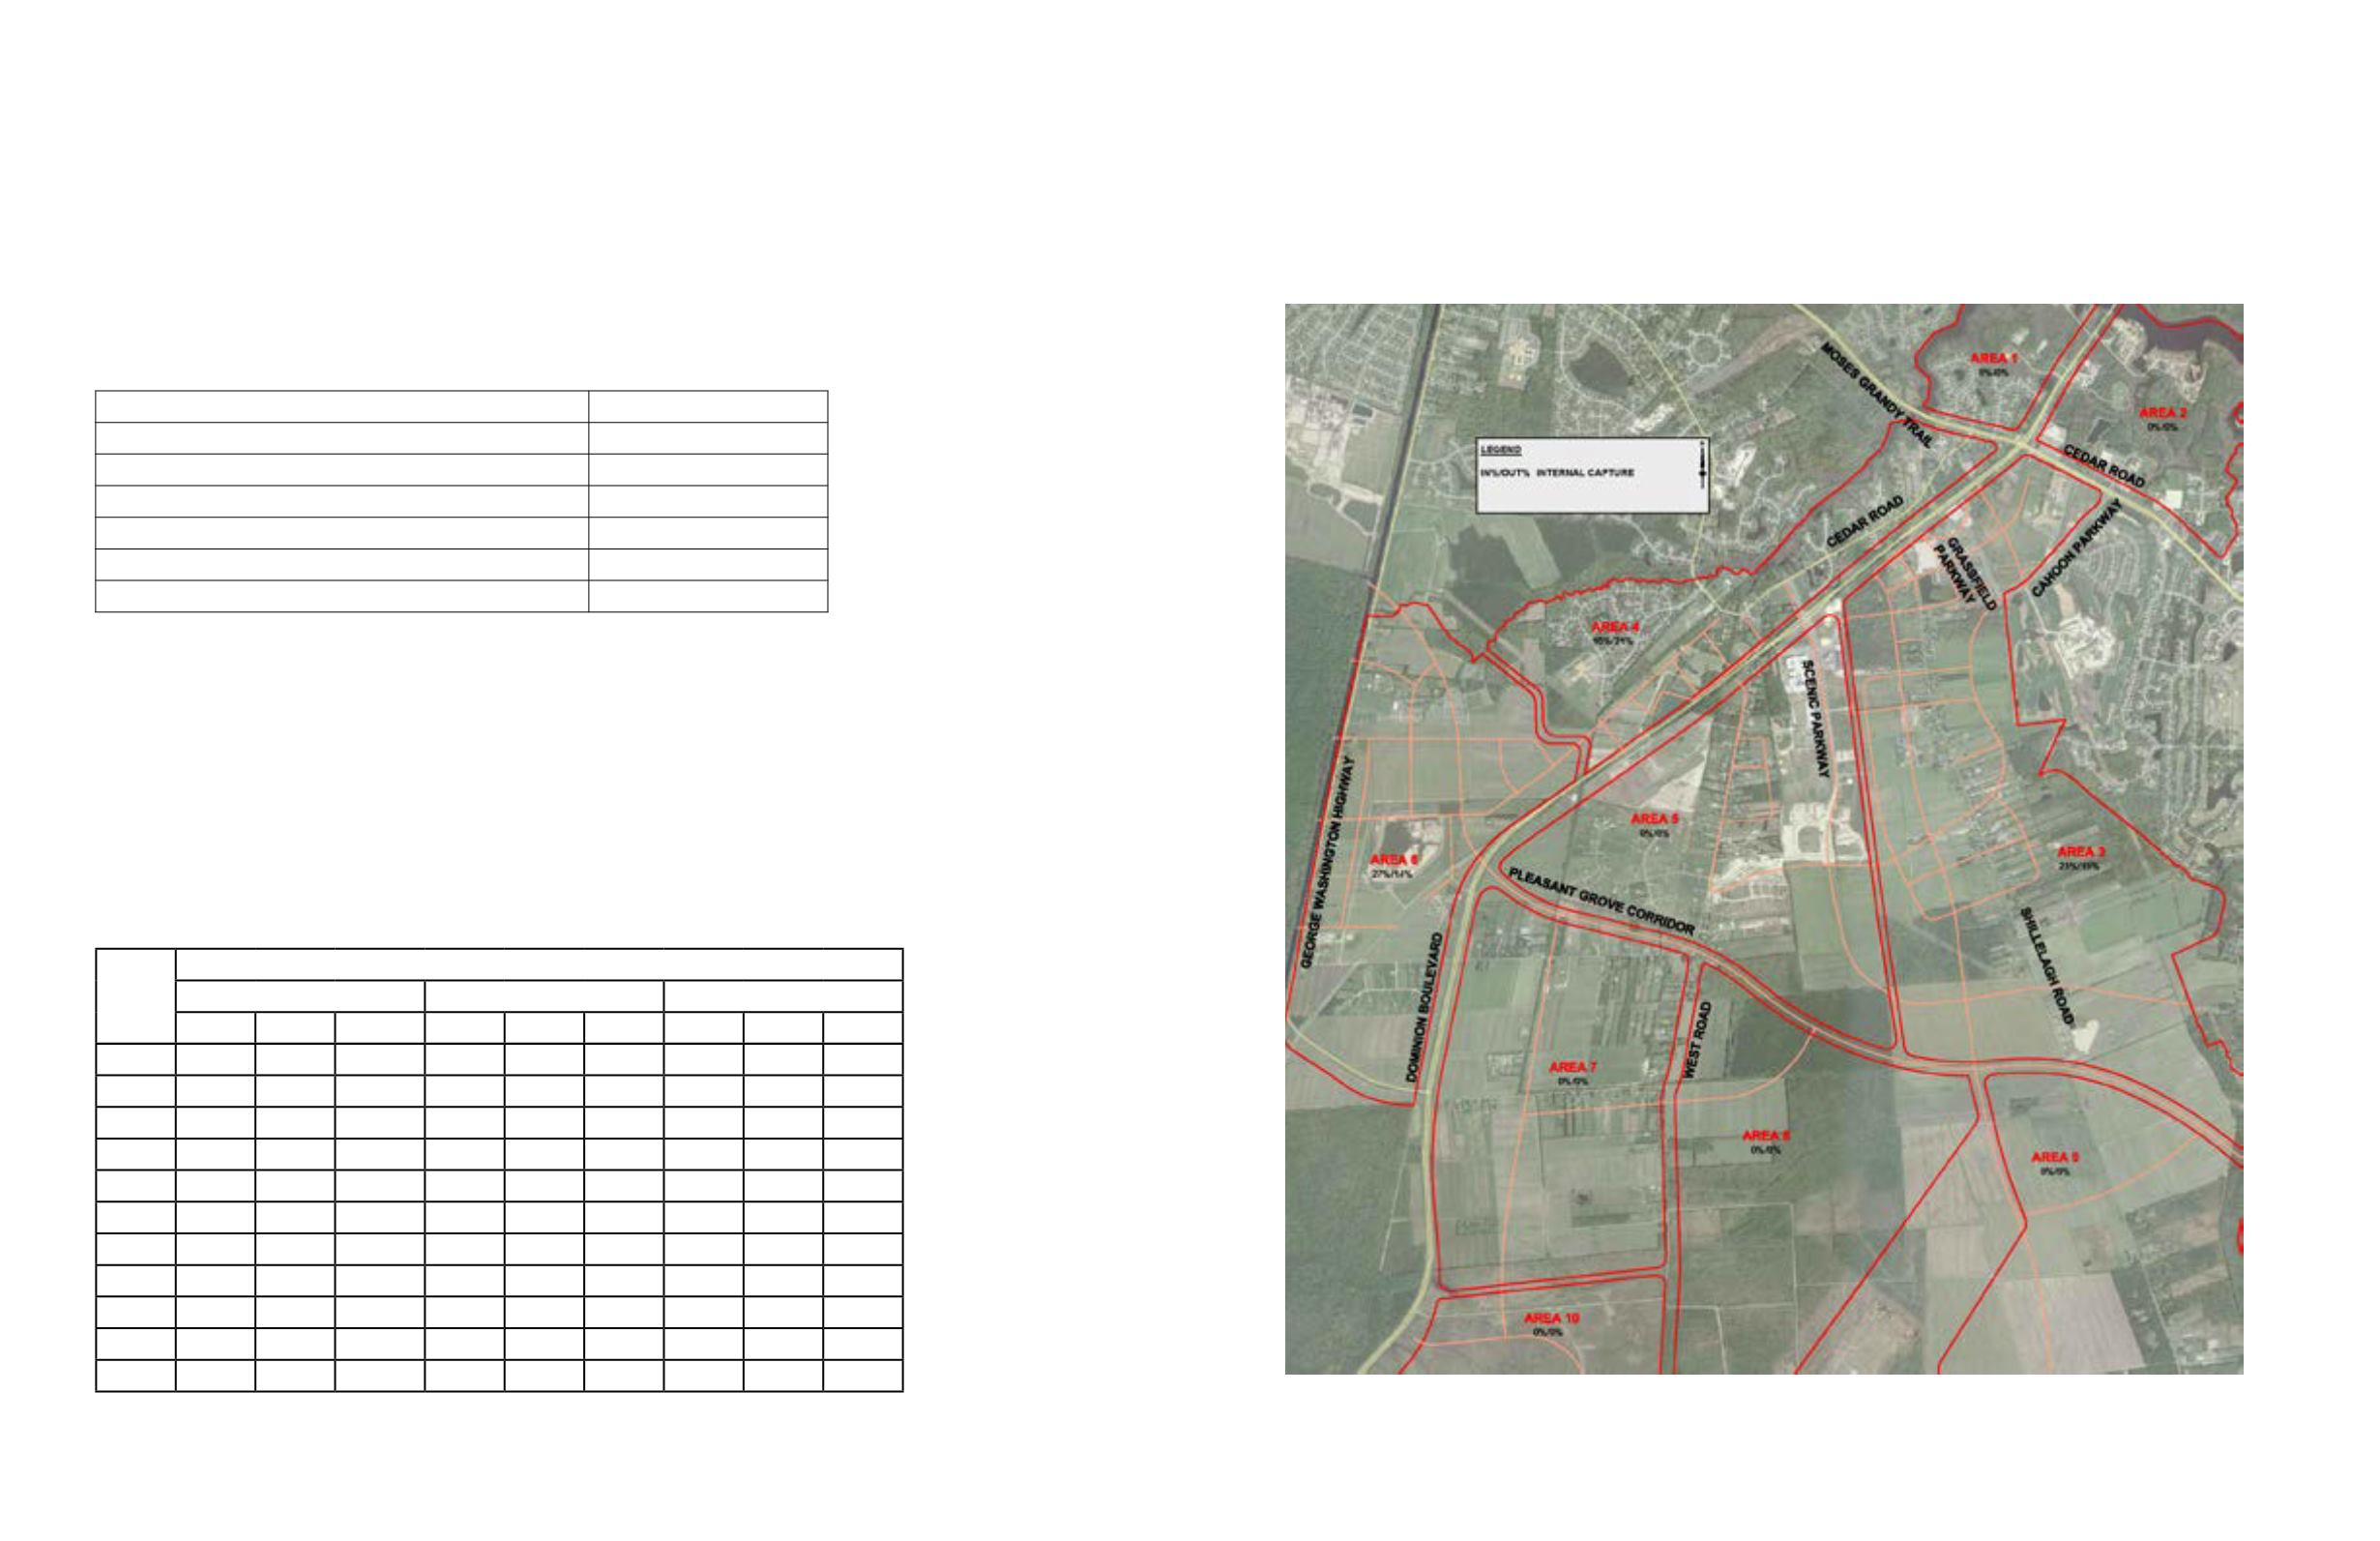
table below. Internal and pass-by trip reduction factors were considered for this develop-
ment. The ITE Trip Generation Manual, 9th edition provides a multi-use development trip
generation and internal capture summary worksheet to assist in calculating the internal
capture rate. The internal capture rates utilized range from 0 percent to 27 percent depend-
ing on the particular area land uses.
Area
Trip Generation Summary
Average Daily Trips
AM Peak Hour
PM Peak Hour
Enter
Exit
Total
Enter
Exit
Total
Enter
Exit
Total
1 2,331 2,331 4,662 561 115 676 144 509 653
2 4,274 4,273 8,547 1,028 211 1,239 264 934 1,198
3 18,795 18,789 37,584 1,754 681 2,435 1,008 1,771 2,779
4 2,951 2,949 5,900 113 271 384 294 182 476
5 3,796 3,794 7,590 122 463 585 472 256 728
6 23,173 23,167 46,340 3,242 1,304 4,546 1,411 3,113 4,524
7
857 857 1,714 34 101 135 113 67 180
8
391 390 781
16
46
62
52
30
82
9
943 942 1,885 37 112 149 125 73 198
10* 7,667 7,667 45,334 1,781 243 2,024 256 1,878 2,134
Totals 65,178 65,178 130,337 8,688 3,547 12,235 4,139 8,813 12,952
Figure 72: Internal capture for each area
Table 8: Trip generation summary
Table 7: Level of service for key intersections
*Area 10 is considered as an opportunity area and has only been analyzed for 2.2 million
square feet of industrial space rather than 6.8 million square feet. As development occurs
the impact to the roadway network should be closely monitored. Once the 2.2 million square
feet have been realized, each new development impact should be analyzed, and associated
improvements needed incorporated into the Master transportation plan


