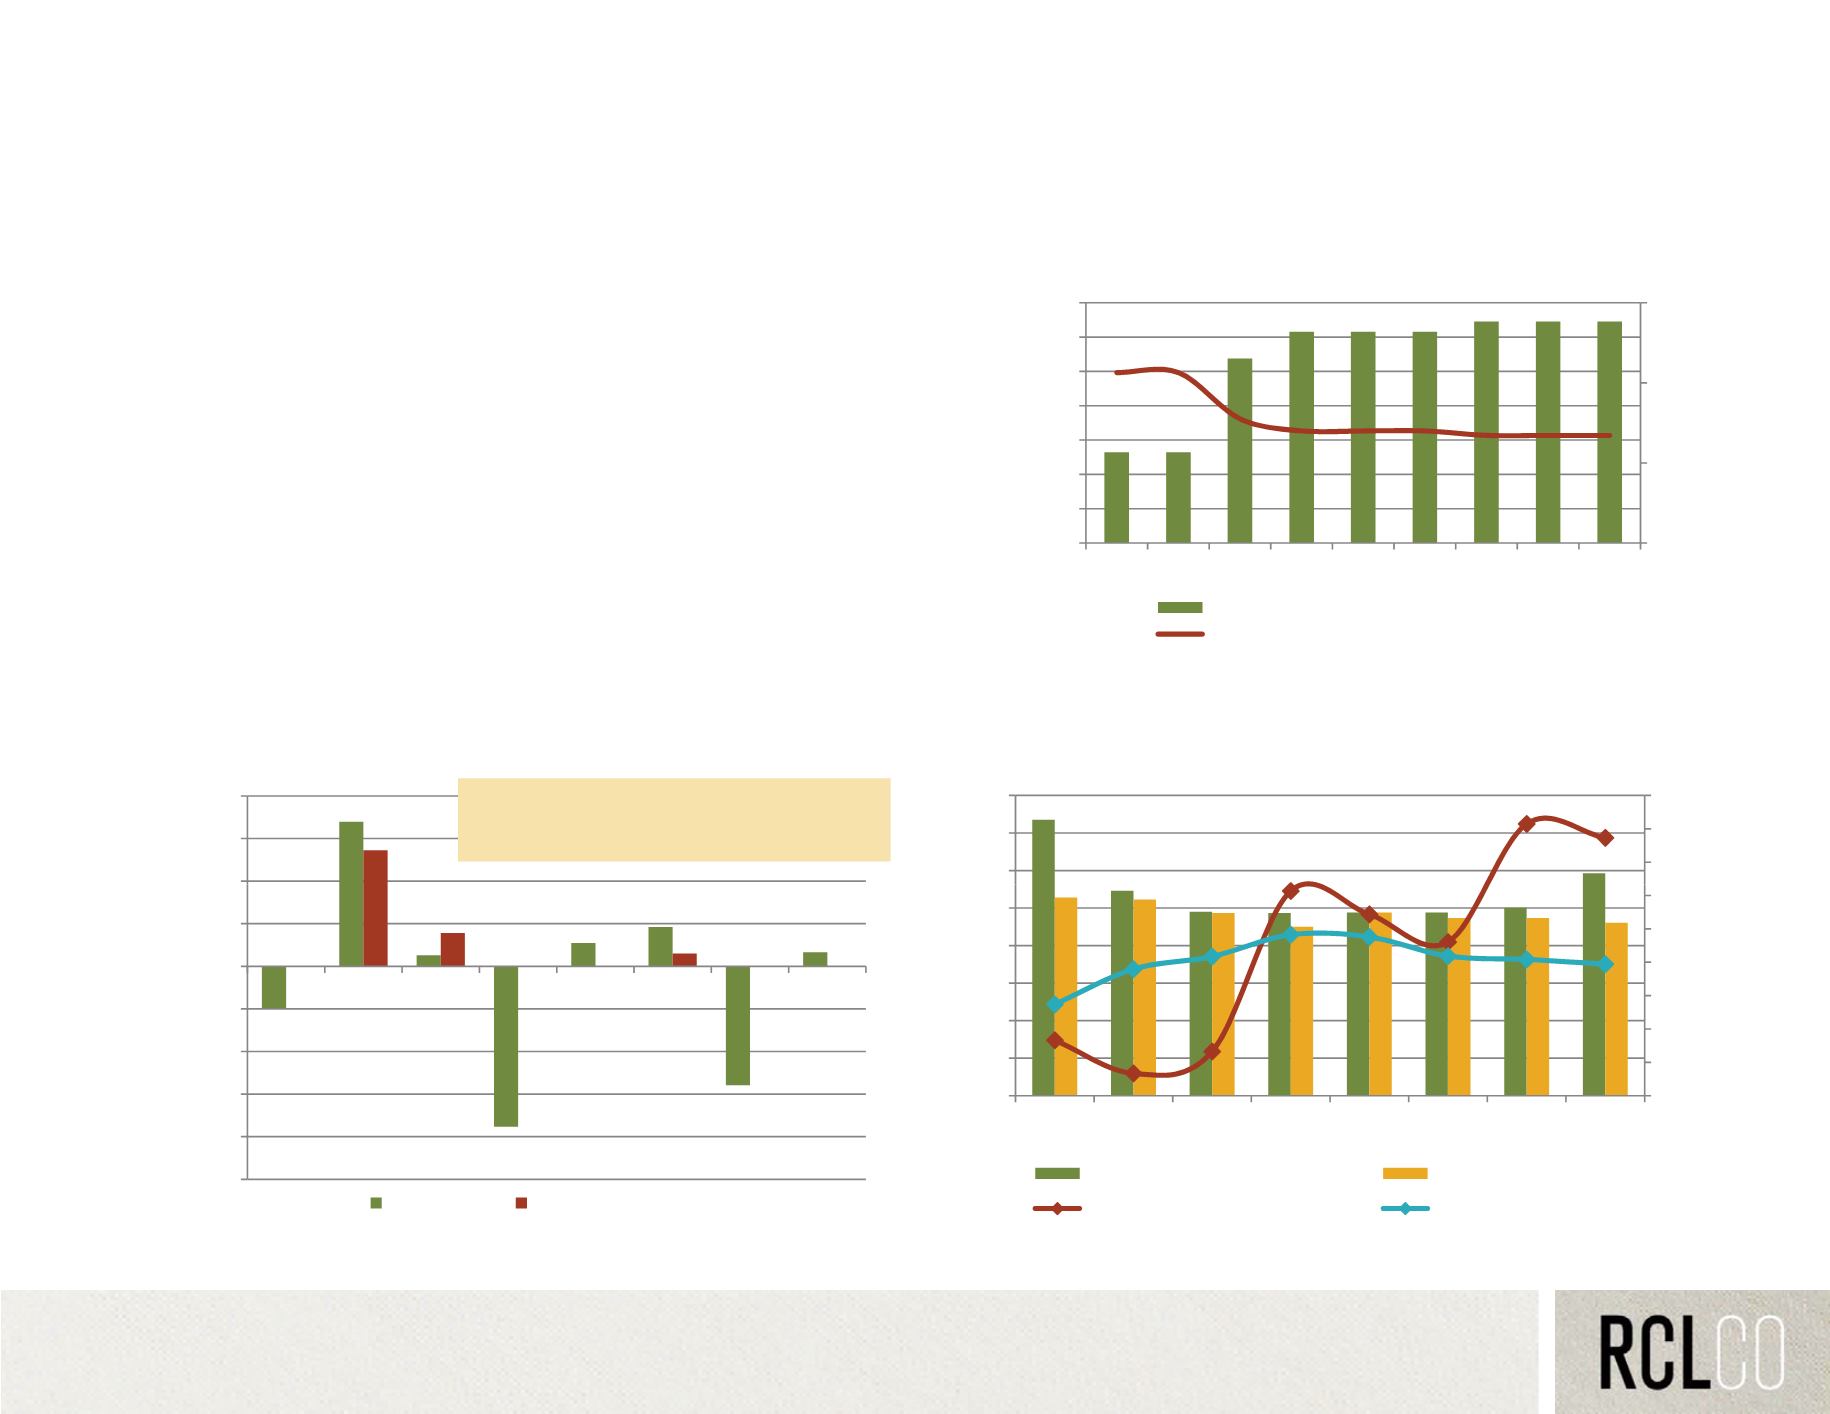
Deep Creek Submarket Industrial Market
The Deep Creek Submarket (see page 39 for map) added 200,000
square feet of industrial space from 2006 to 2008, but has seen no
change in inventory since that time. The Dominion Boulevard study
area itself has not added industrial space in the past decade.
4.5%
1,950,000
2,000,000
Industrial Inventory
Study Area; Deep Creek Submarket; 2005-2013
The submarket experienced a negative net absorption of approximately
-100,000 square feet of industrial space between 2006 and 2014Q1.
During the same time period, 190,000 square feet of space was
delivered. This has led the vacancy rate to climb from 2% in 2007 to
15% in 2013. The MSA has maintained a 6% to 8% vacancy from 2006
to 2013. Average industrial asking rent in the MSA has dropped from
3.5%
4.0%
1,700,000
1,750,000
1,800,000
1,850,000
1,900,000
$5.28 in 2006 to $4.61 in 2013. Deep Creek Submarket commands a
slightly higher rent than the MSA.
3.0%
1,650,000
2005 2006 2007 2008 2009 2010 2011 2012 2013
Deep Creek Submarket
Study Area as % of Submarket
Source: CoStar
100 000
150,000
200,000
2006-2013 Avg. Absorption:
-13,000
2006-2013 Avg. Completion:
24,000
14%
16%
18%
$6
$7
$8
Industrial Absorption vs. Completions
Deep Creek Submarket; 2006-2013
Industrial Asking Rent and Vacancy
Deep Creek Submarket and MSA; 2006-2013
-100,000
-50,000
0
50,000
,
2006 2007 2008 2009 2010 2011 2012 2013
2%
4%
6%
8%
10%
12%
$1
$2
$3
$4
$5
-250,000
-200,000
-150,000
Absorption Completions
0%
$0
2006 2007 2008 2009 2010 2011 2012 2013
Deep Creek Rent (NNN)
MSA Rent (NNN)
Deep Creek Vacancy
MSA Vacancy
Dominion Boulevard | City of Chesapeake | April 11, 2014 | E4-11982.40
37
Source: CoStar
Source: CoStar


