28 |
        
        
          P a g e
        
        
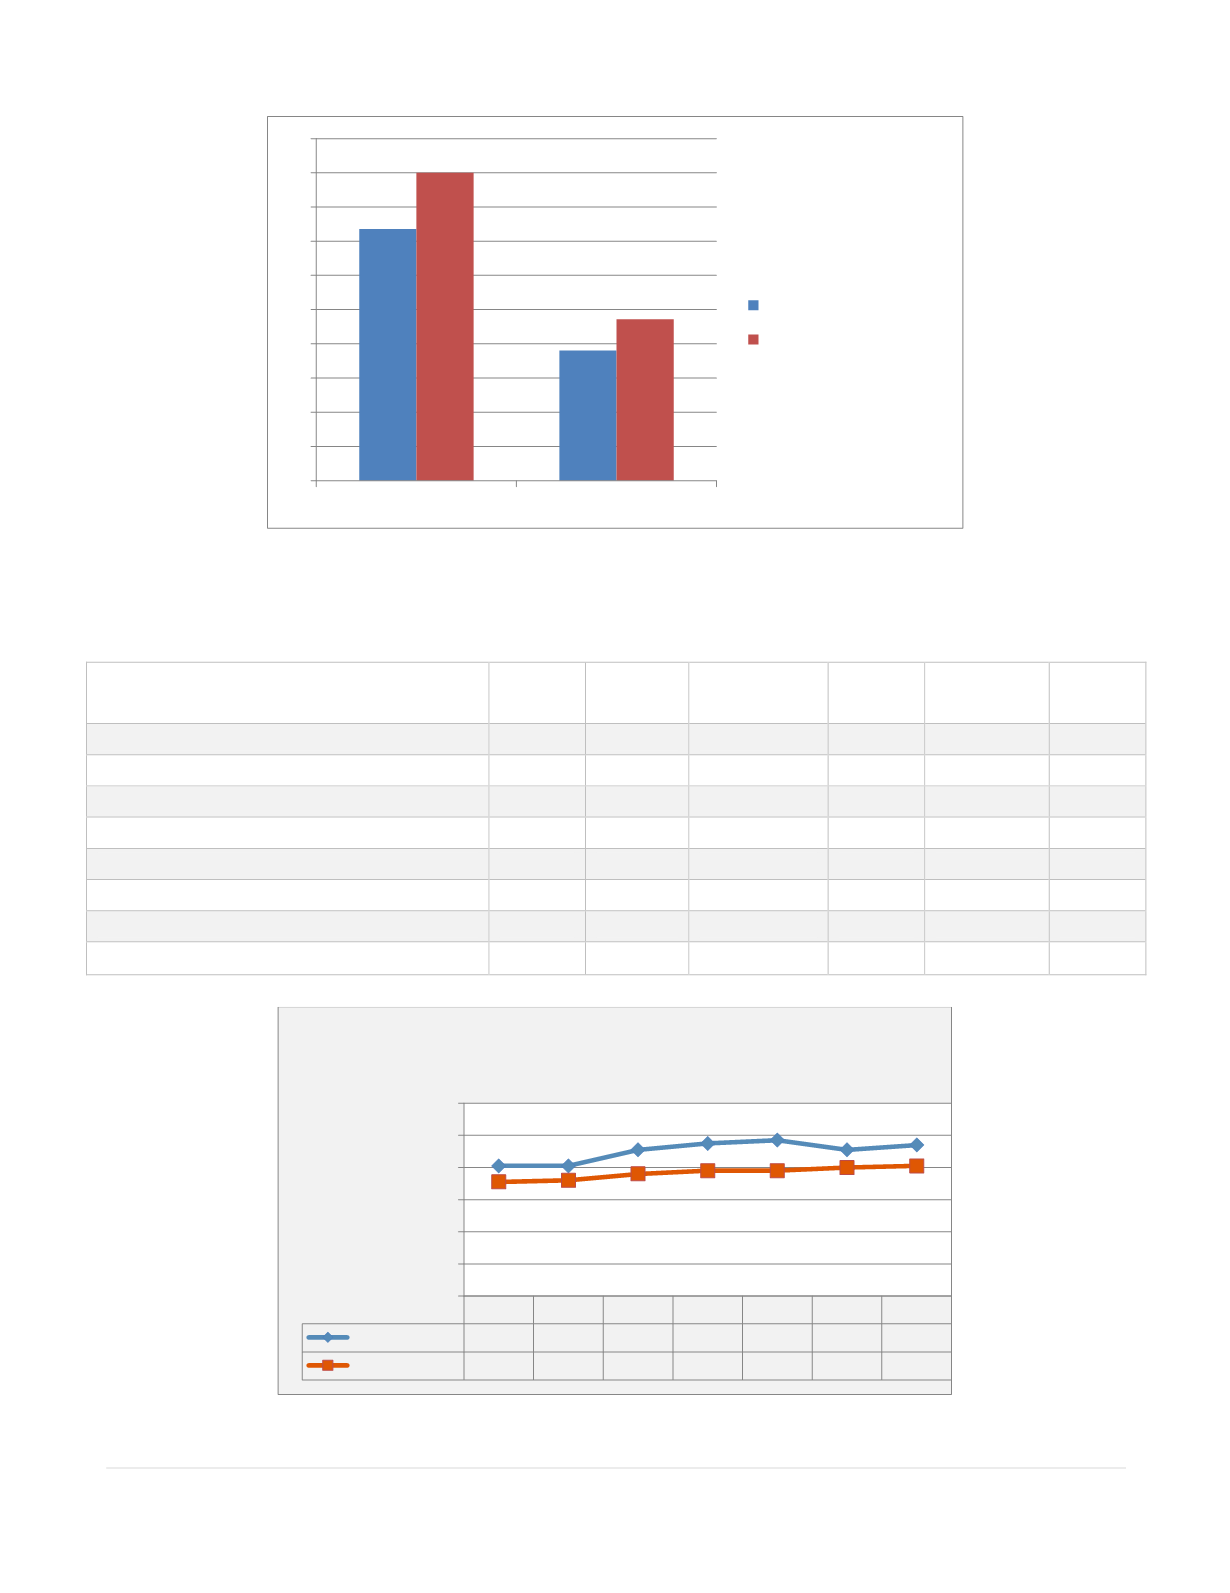
          The Virginia Community Health Atlas 2013, shows that Chesapeake has higher age adjusted
        
        
          mortality rates than the Hampton Roads average for a number of chronic conditions.
        
        
          Virginia Community Health Atlas, 2013
        
        
          Age Adjusted Death Rates per 100,000
        
        
          Virginia
        
        
          Total
        
        
          Hampton
        
        
          Roads
        
        
          Chesapeake
        
        
          Norfolk Portsmouth
        
        
          Virginia
        
        
          Beach
        
        
          Malignant Neoplasms
        
        
          169.5
        
        
          182.1
        
        
          188.6
        
        
          196.6
        
        
          255.3
        
        
          156.6
        
        
          Heart Disease
        
        
          161.3
        
        
          172.7
        
        
          181.6
        
        
          205.5
        
        
          190.5
        
        
          137.7
        
        
          Cerebrovascular Diseases
        
        
          41.4
        
        
          41.7
        
        
          40.9
        
        
          51.5
        
        
          57
        
        
          31.9
        
        
          Chronic Lower Respiratory Diseases
        
        
          38.4
        
        
          42.5
        
        
          39.6
        
        
          48.9
        
        
          42.9
        
        
          40.8
        
        
          Alzheimer's Disease
        
        
          23
        
        
          28.5
        
        
          30.8
        
        
          24.3
        
        
          27.9
        
        
          28.0
        
        
          Nephritis and Nephrosis
        
        
          17.6
        
        
          20.9
        
        
          22.0
        
        
          27.2
        
        
          --
        
        
          16.3
        
        
          Diabetes Mellitus
        
        
          19.4
        
        
          24
        
        
          25.6
        
        
          29.9
        
        
          32
        
        
          16.3
        
        
          Influenza and Pneumonia
        
        
          17.4
        
        
          16
        
        
          16.1
        
        
          15.7
        
        
          --
        
        
          15.4
        
        
          0
        
        
          5
        
        
          10
        
        
          15
        
        
          20
        
        
          25
        
        
          30
        
        
          35
        
        
          40
        
        
          45
        
        
          50
        
        
          Stroke
        
        
          Diabetes Related
        
        
          Mortality (deaths per 100,000 population)
        
        
          County Median
        
        
          Chesapeake Actual
        
        
          2004 2005 2006 2007 2008 2009 2010
        
        
          Chesapeake 8.1 8.1 9.1 9.5 9.7 9.1 9.4
        
        
          Virginia
        
        
          7.1 7.2 7.6 7.8 7.8 8.0 8.1
        
        
          0
        
        
          2
        
        
          4
        
        
          6
        
        
          8
        
        
          10
        
        
          12
        
        
          Age-Adjusted Estimates of the Percentage
        
        
          of Adults with Diagnosed Diabetes
        
        
          (a)