Dimension
Priority
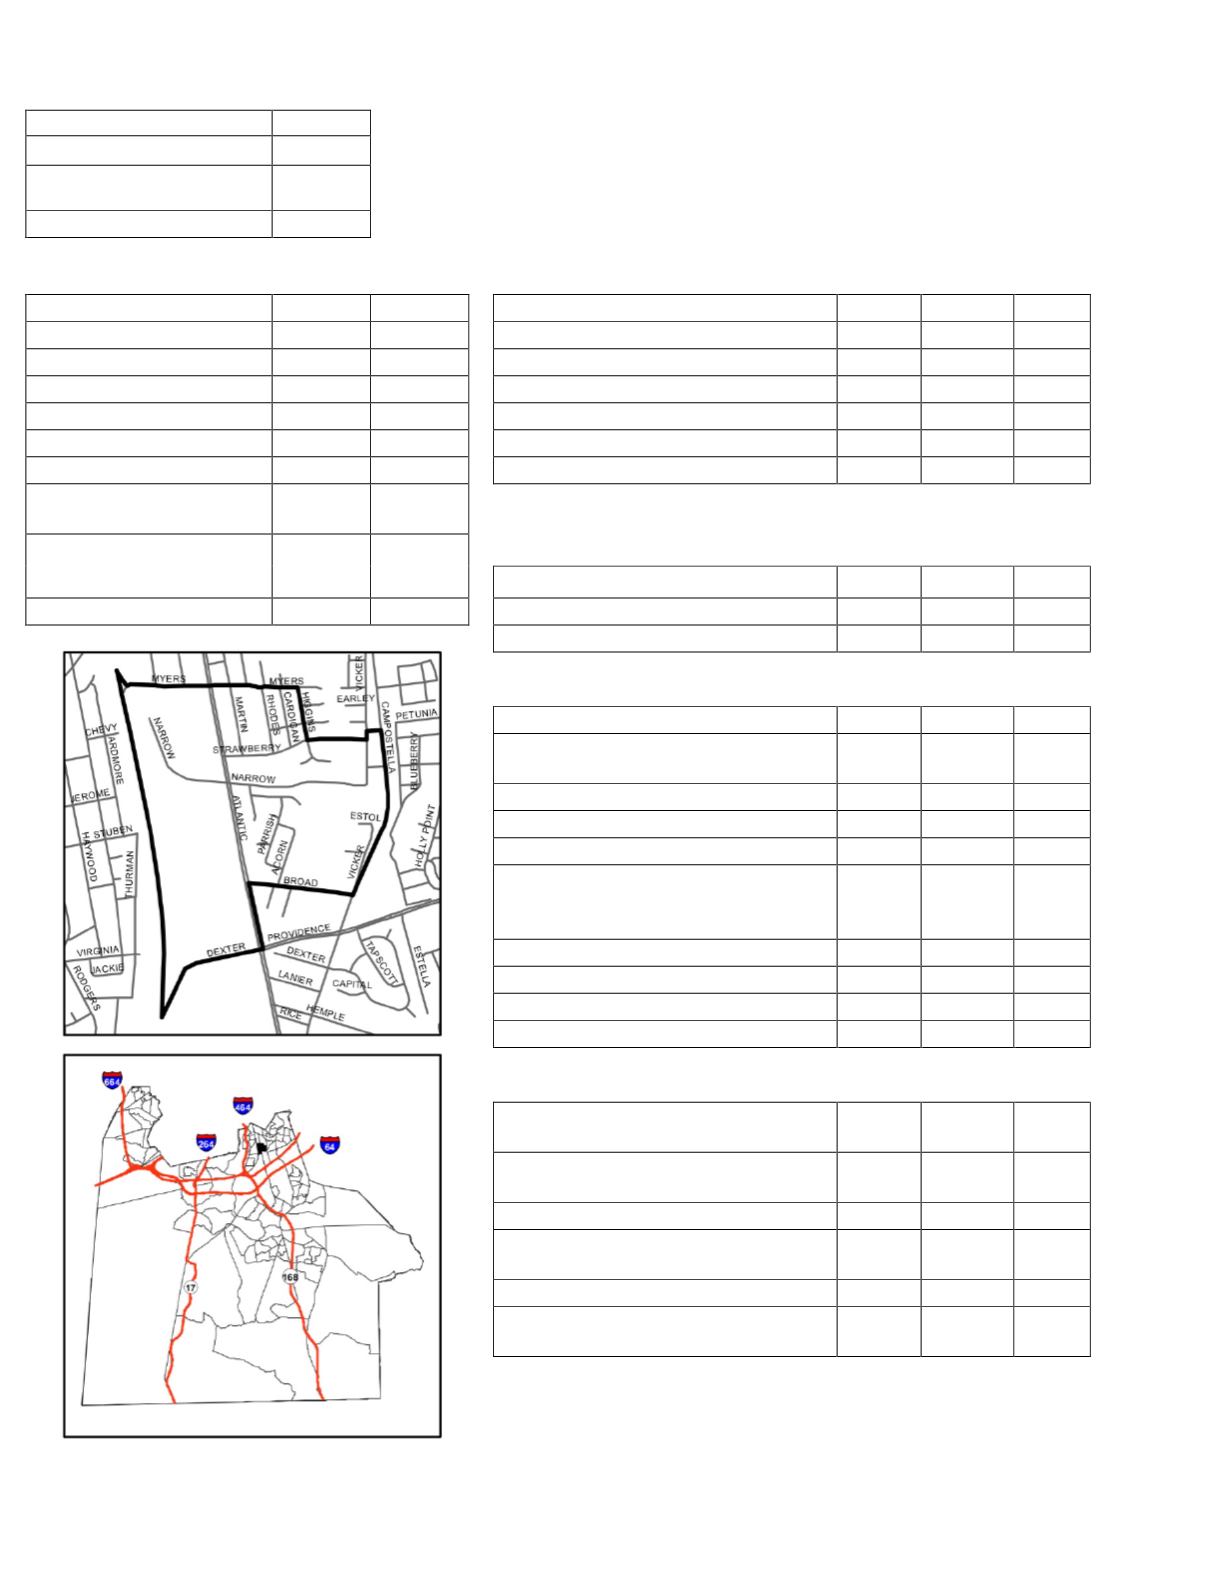
Tract: 202.00
Social
Block Group: 1
Crime
Physical
Dimensional Priority Score: 3
Economic
Profile
NSA
City
Social
Priority
NSA
City
Population
1,034
223,233
Percent of Persons over Age 64
10.1% 10.0%
Population Growth
-3.0%
1.8%
Percentage of Persons Ages 5-19
29.2% 22.8%
Youth Population
370
57,767
Infant Wellness
2.9
2.9
Median Household Income
$21,553
$70,244
Percent of Child Welfare Cases
0.6%
0.2%
Number of Housing Units
356
82,763
Percent of Households Receiving TANF
4.0%
1.2%
Median House Value
$164,600 $267,700
Percent of Households Receiving SNAP
40.1% 14.0%
Change in Housing Values
118.6%
118.9%
Youth Opportunity Score
0.9
0.6
Percent of Neighborhood
that is Residential
53.9%
18.7%
Percent Residential
Apartment Units
49.3%
15.9%
Crime
Category A Victim Crime Index
1.2
1.0
Area (Acres)
233
224,901
Category A Non-Victim Crime Index
0.8
1.0
Category B Crime Index
2.0
1.0
Physical
Percent Home Ownership
58.6% 74.9%
Percent of Single Family Dwellings
Older than 50 years
21.5% 18.9%
Percent Code Enforcement
Medium
Low
Sidewalk Completeness Score
High
Low
Access to Public Transportation
100.0% 21.0%
Percent of Persons Using a Means
Other than an Automobile to Get to
Work
9.3%
2.1%
Access to Basic Retail Facilities
100.0% 62.0%
Access to Park Facilities
0.0% 44.8%
Proximity to Noxious Facilities
13.9% 10.3%
Drainage Score
0.0
0.3
Economic
Homeowner Housing Costs as a
Percentage of Income
13.9% 24.6%
Affordable Housing Access for Families
Seeking Housing Assistance
No
No
New Residential Building Permits
3
792
Percent Residential Addition
Investments
0.0%
0.7%
Percent Change in Income
-3.0% 38.4%
Percent of Tax Delinquent Residential
Parcels
11.0%
5.8%
Comments:
The NSA falls within the Urban overlay.
November 2014
B-20


