Overall Rental Market
Map of Norfolk/Hampton Roads Region
4
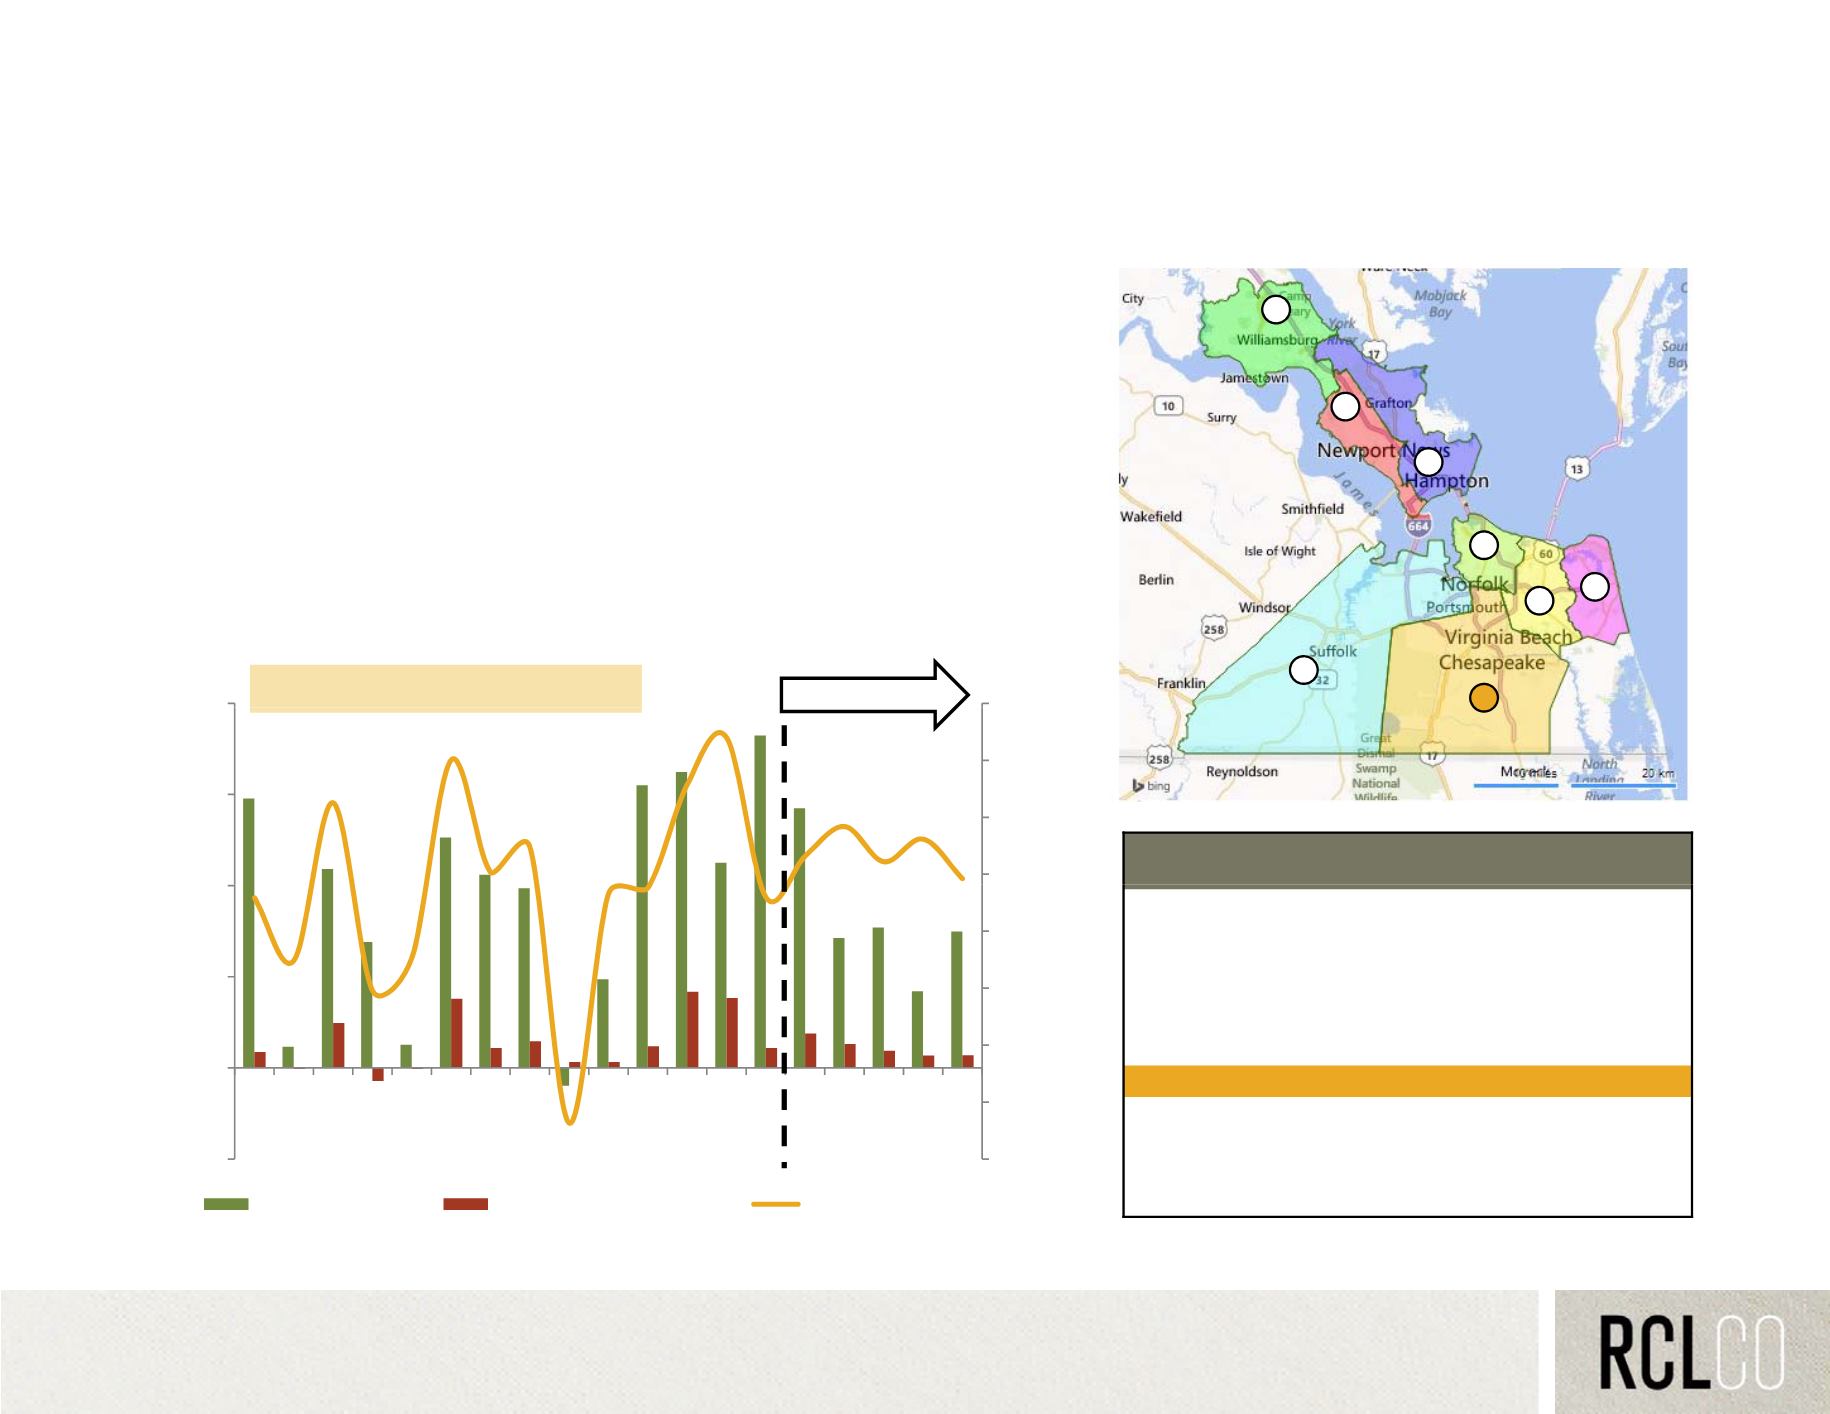
The Chesapeake submarket and the Hampton Roads region have historically
experienced balanced deliveries and net absorption. From 2000 to 2013, the submarket
has, on average, delivered 150 units and absorbed a net of 133 units annually, capturing
9% of rental absorption in the region. The Chesapeake submarket absorbed 418 units in
2011 and delivered 523 units in 2012 both marking the highest levels in at least two
7
3
,
decades. The submarket’s capture of regional rental absorption also reached a record
high of over 30% in 2012, though the long term trend points to future capture at around
10% to 15%. Chesapeake, like much of the region, is experiencing healthy vacancies
and rental rates. Though the submarket does not command rents as high as Kempsville
and Lynnhaven, it is located near the more expensive areas and has room to grow.
40%
2 000
PROJECTED
2000-2013 AVG. CAPTURE:
9%
8
5
6
2 1
Apartment Submarket Absorption Capture
Chesapeake and Norfolk/Hampton Roads Region; 2000-2013
MAP
KEY SUBMARKET BUILD-
INGS UNITS ASKING
RENT VAC.
10%
20%
30%
1 000
1,500
,
1 Kempsville/
Bayside
80 16,271 $1,058 4%
2 Lynnhaven/
Oceana
49 9,867 $1,026 6%
3 Hampton/York
70 12,146 $978 3%
4 Williamsburg
19 2,790 $969 3%
-20%
-10%
0%
0
500
,
5 Chesapeake
43 7,793 $958 4%
6 Norfolk
114 15,854 $889 3%
7 Newport News 103 19,374 $827 4%
8 Portsmouth/
Suffolk
45 6,966 $785 3%
-40%
-30%
-500
2000 2002 2004 2006 2008 2010 2012 2014 2016 2018
Metro Absorption Chesapeake Absorption % Capture of Region
Dominion Boulevard | City of Chesapeake | April 11, 2014 | E4-11982.40
54
Source: Reis
Source: Reis


