 
          Appendix  |  175


            Migration


            IN MIGRATION DISTRIBUTION


            DOMESTIC


            IN MIGRANTS


            % OF


            TOTAL


            IN MIGRATION


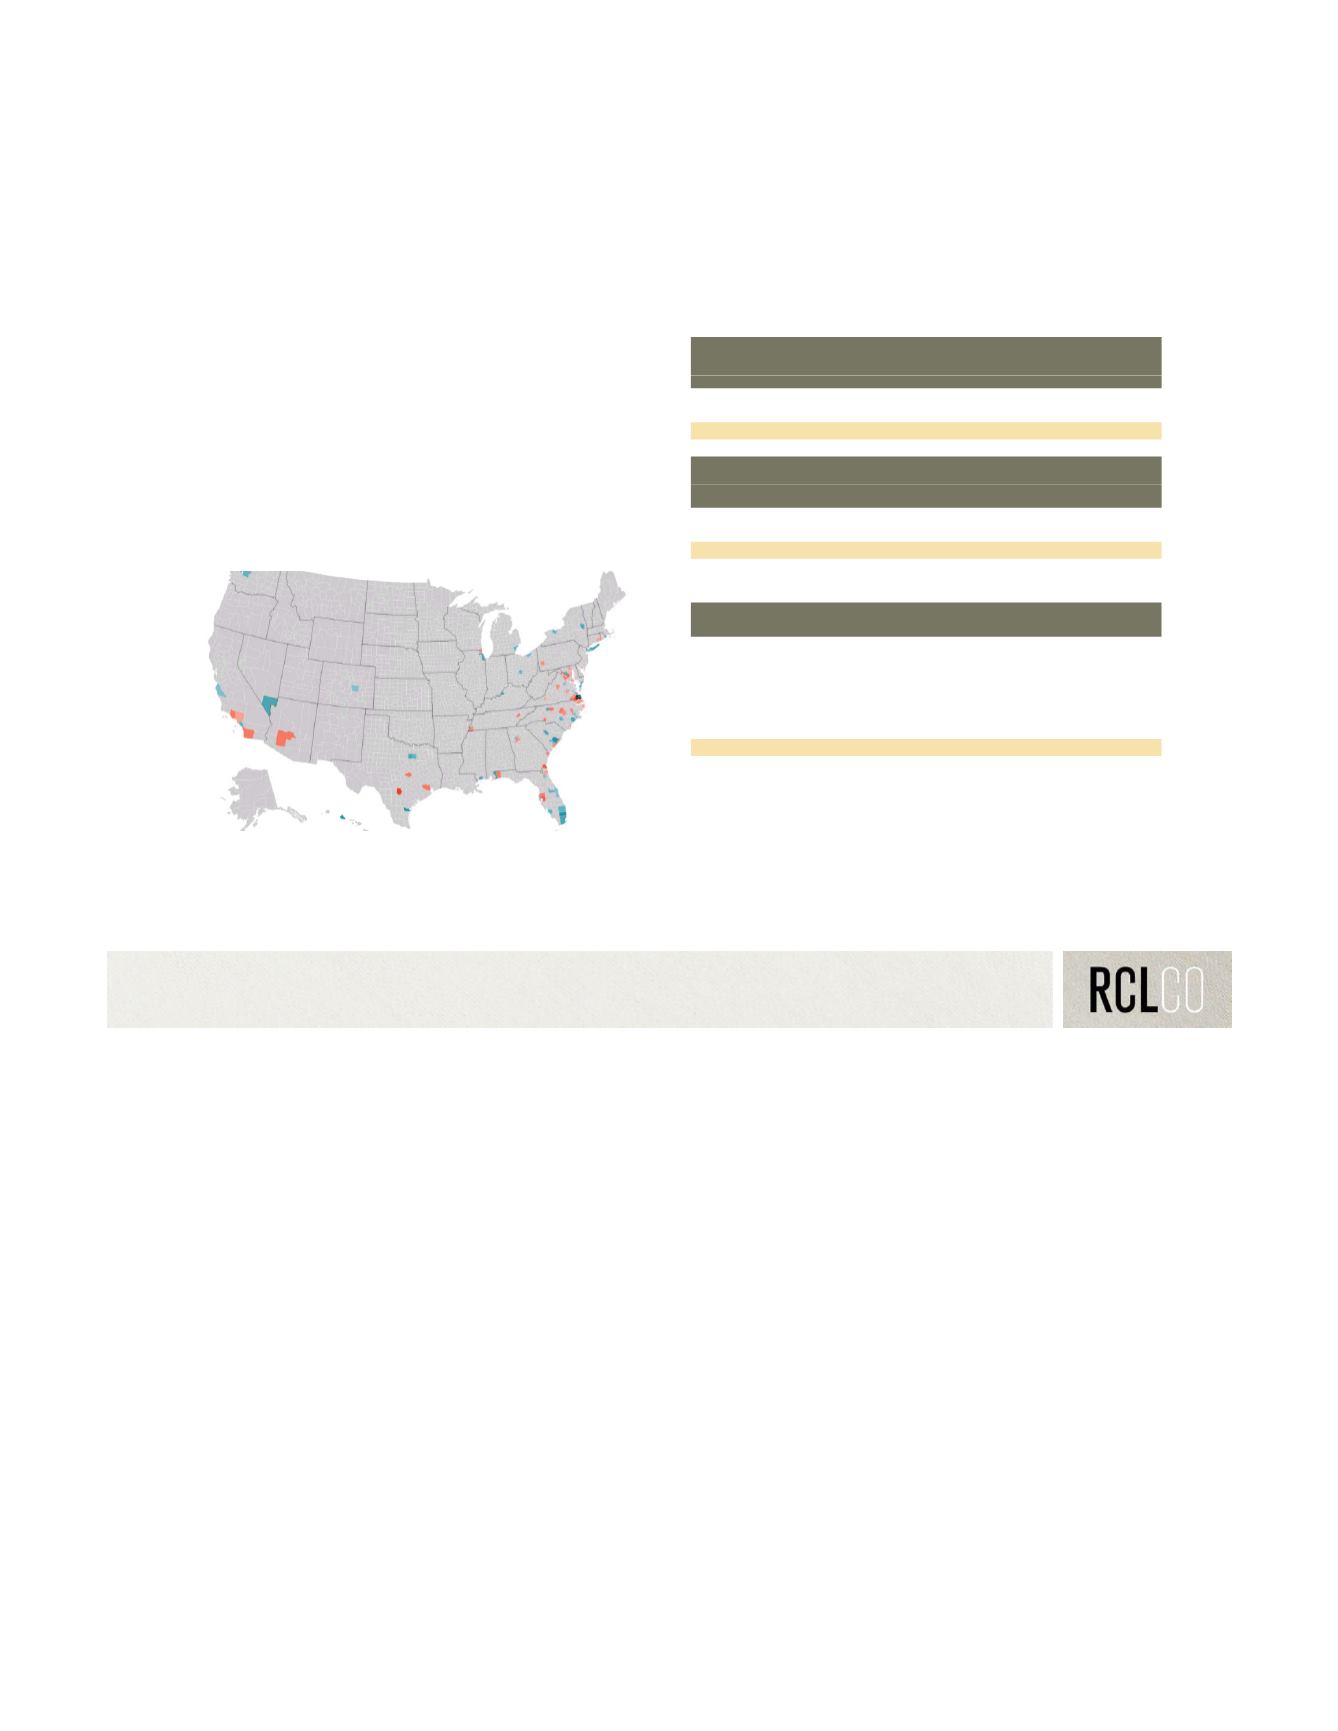
          Chesapeake City has strong same-state in-migration and same-state
        
        
          out-migration based upon IRS migration data. Approximately 5,500 of
        
        
          the 8,300 domestic in-migrants to Chesapeake City are from Virginia, of
        
        
          which 60% are from the Hampton Roads area. This suggest the city is
        
        
          a popular choice for people moving within the region The next biggest


              Domestic Population Migration


              Chesapeake City, VA; 2009-2010


            -


            -


            -


            Same State In-Migration


          5,519


            66%


            Different State In-Migration


          2,847


            34%


            TOTAL DOMESTIC IN-MIGRATION


            8,366


            100%


            DOMESTIC


            % OF TOTAL


            OUT-


          .
        
        
          source markets (although accounting for a total of less than 10%) are
        
        
          North Carolina, Florida, and Maryland.
        
        
          Approximately 5,000 of the 8,000 out-migrants from the city move to
        
        
          another location within Virginia.


            OUT-MIGRATION DISTRIBUTION


            OUT-MIGRANTS MIGRATION


            Same State Out-Migration


          4,887


            63%


            Different State Out-Migration


          2,887


            37%


            TOTAL DOMESTIC IN-MIGRATION


            7,774


            100%


            TOP STATES OF ORIGIN


              Domestic Migration Patterns


              Chesapeake City, VA; 2009-2010


            AREA


            DOMESTIC


            IN-MIGRANTS


            % OF DOMESTIC


            IN-MIGRATION


          Virginia
        
        
          5,519
        
        
          66.0%
        
        
          North Carolina
        
        
          307
        
        
          3.7%
        
        
          Florida
        
        
          238
        
        
          2.8%
        
        
          Maryland
        
        
          112
        
        
          1.3%
        
        
          California
        
        
          110
        
        
          1.3%
        
        
          New York
        
        
          107
        
        
          1.3%


            TOTAL


            8,366


          Blue = more in-migrants
        
        
          Red = more out-migrants
        
        
          Dominion Boulevard  |  City of Chesapeake  |  April 11, 2014 |  E4-11982.40
        
        
          30


            Source: Internal Revenue Service; Forbes.com


            Source: Internal Revenue Service; Forbes.com