5 |
P a g e
the needs of the older population and the working age population contributes economically to
fund the retirement and health care benefits for the older population. The dependency ratio is
the ratio of the population 65 and older compared to the working population. For Chesapeake,
it is projected to drop significantly from 2014 to 2040.
Population 65+ Population 15-64 Dependency Ratio
2014
25,446
156,645
6.2
2020
34,891
167,716
4.8
2030
50,537
177,101
3.5
2040
54,588
200,112
3.7
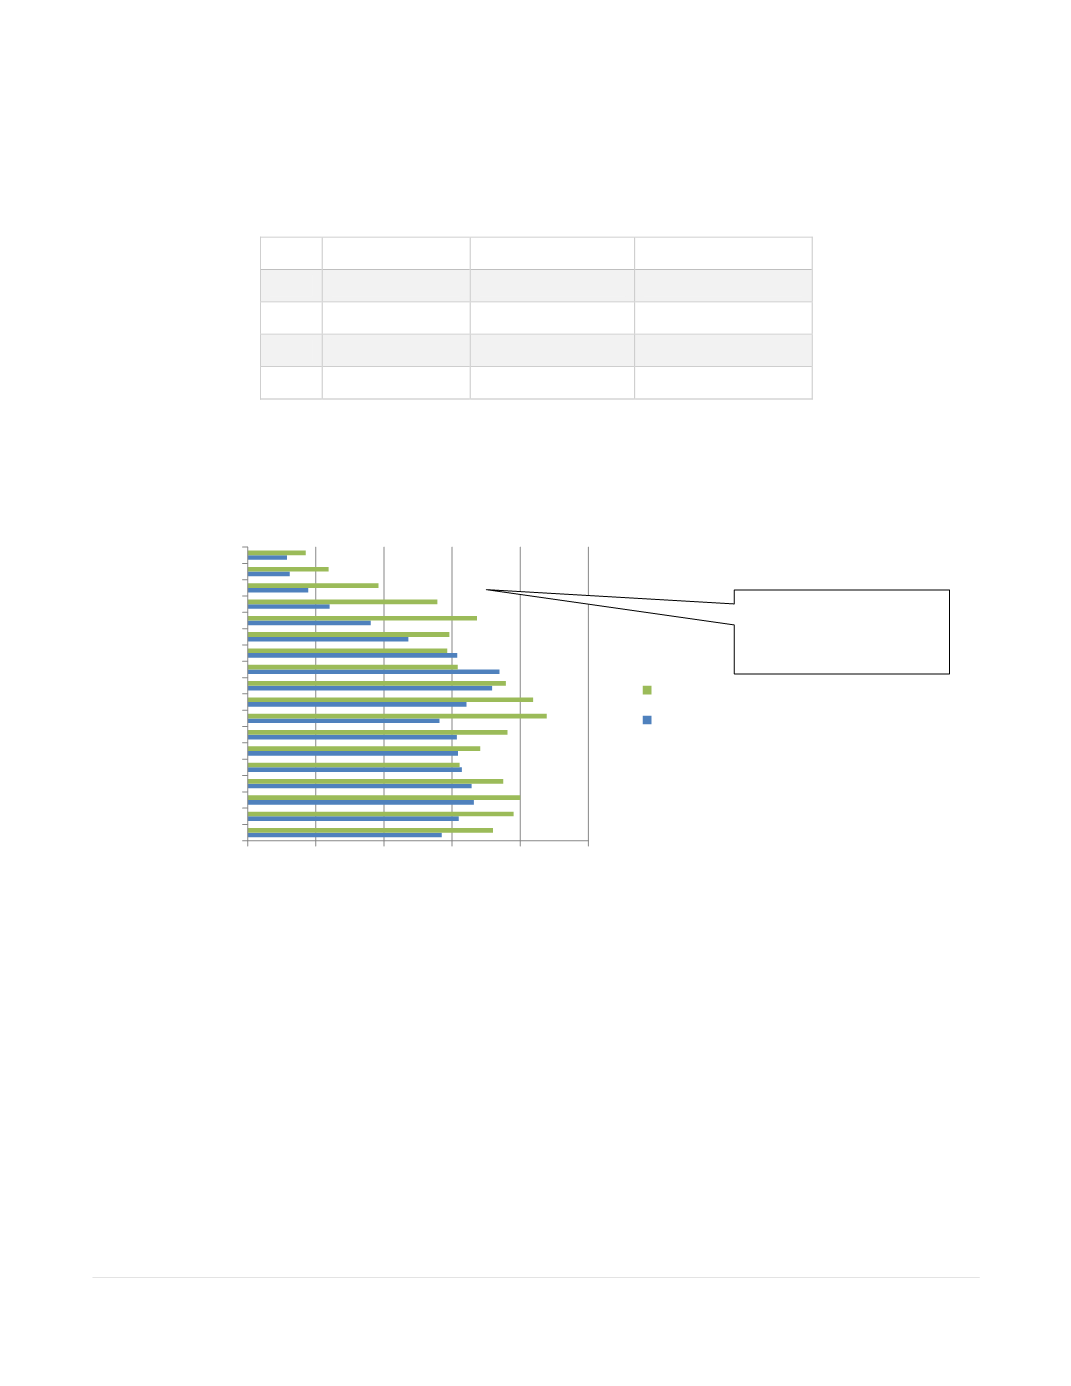
With the changes over the next few decades, the age pyramid will significantly shift. The
groups at the older part of the pyramid will grow while the proportion in the working ages will
shrink.
Within the City, the senior population is distributed unevenly. With 78% of the population
desiring to age in place, that will result in variations in need for services in different
neighborhoods.
0 5,000 10,000 15,000 20,000 25,000
0 to 4
10 to 14
20 to 24
30 to 34
40 to 44
50 to 54
60 to 64
70 to 74
80 to 84
Chesapeake Age Pyramid
2030
2012
9% of the City’s
population is 75+
by 2040


