4 |
        
        
          P a g e
        
        
          2.  Why Is This Plan Important?
        
        
          The populations of Chesapeake, the Commonwealth of Virginia, the U.S., and the world are all
        
        
          growing older due to increasing life spans along with rapidly declining birth rates.  In the U.S.,
        
        
          the added impact of the Baby Boomer generation also contributes significantly to the increase
        
        
          in the older population.
        
        
          Population aging will shape local, regional, national and international economies and
        
        
          policymaking unlike any other demographic shift witnessed to date.
        
        
          1
        
        
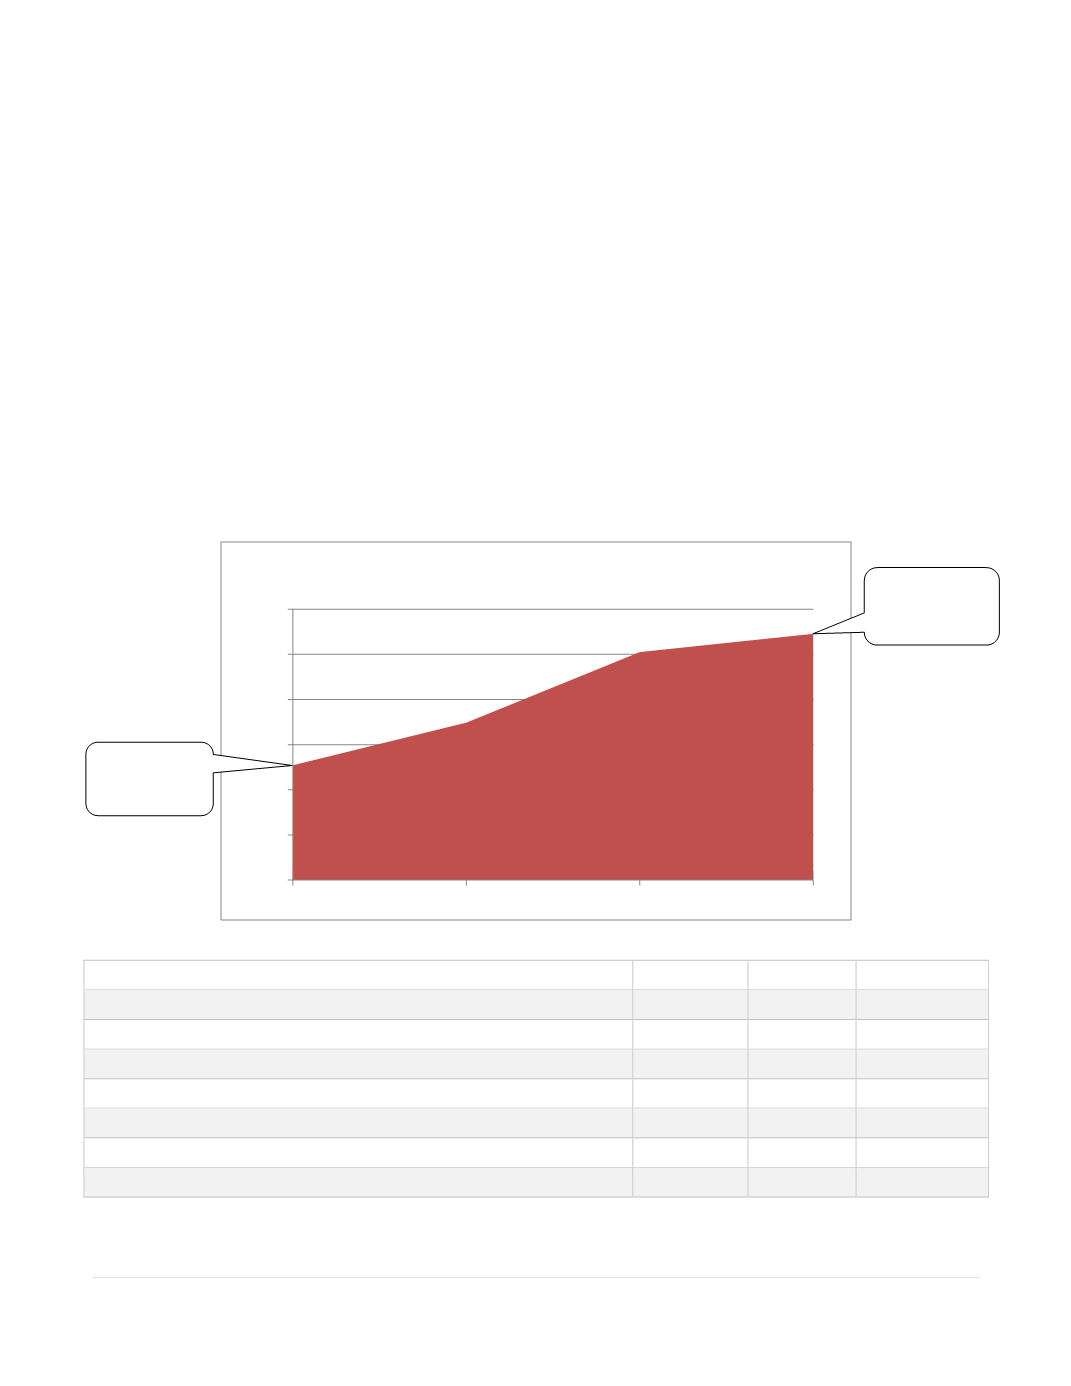
          In the Chesapeake area, between 2012 and 2040, the Welden Cooper Population Center
        
        
          projects a growth of 114.5% in the number of those aged 65 and older compared to an
        
        
          increase of 39.4% in the city’s population overall.
        
        
          2
        
        
          As shown in the chart and table below,
        
        
          over the next two decades both the number and the proportion of older adults in Chesapeake
        
        
          are projected to increase at greater rates than in Virginia or the U.S. as a whole
        
        
          .
        
        
          Projected Population
        
        
          US (1,000s)
        
        
          Virginia
        
        
          Chesapeake
        
        
          Number of persons aged 65+ in 2012
        
        
          40,229  1,062,505
        
        
          25,446
        
        
          Proportion of persons aged 65+ in 2012
        
        
          13.00%
        
        
          25.3%
        
        
          11.1%
        
        
          Number of persons aged 65+ in 2040
        
        
          79,719
        
        
          2,990,547
        
        
          54,588
        
        
          Proportion of persons aged 65+ 2040
        
        
          21.0%
        
        
          28.4%
        
        
          17.1%
        
        
          Growth rate in number of persons aged 65+ from 2012 to 2040
        
        
          98.2%
        
        
          181.5%
        
        
          114.5%
        
        
          Growth rate in proportion of persons aged 65+ from 2010 to 2030
        
        
          61.5%
        
        
          12.4%
        
        
          146.0%
        
        
          Growth rate in population overall
        
        
          22.5%
        
        
          28.6%
        
        
          39.4%
        
        
          Not only is the proportion of the older populating growing, but the overall distribution of the
        
        
          population by age is significantly changing.  In society, the working age population supports
        
        
          0
        
        
          10000
        
        
          20000
        
        
          30000
        
        
          40000
        
        
          50000
        
        
          60000
        
        
          2012
        
        
          2020
        
        
          2030
        
        
          2040
        
        
          Population 65+ 2014 to 2040
        
        
          17% of the
        
        
          population
        
        
          11% of the
        
        
          population